|
Download Data (XLS File) |
|
||||||||
|
||||||||
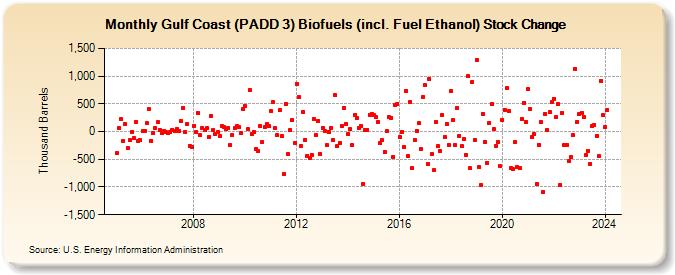
| Gulf Coast (PADD 3) Biofuels (incl. Fuel Ethanol) Stock Change (Thousand Barrels) | ||||||||
| Year | Jan | Feb | Mar | Apr | May | Jun | Jul | Aug | Sep | Oct | Nov | Dec |
|---|---|---|---|---|---|---|---|---|---|---|---|---|
| 2005 | -393 | 63 | 222 | -169 | 134 | -303 | -153 | -7 | -123 | 177 | -168 | -157 |
| 2006 | 4 | 18 | 149 | 398 | -164 | -23 | 60 | 166 | 25 | -33 | 18 | -17 |
| 2007 | -22 | -14 | 35 | 11 | 52 | 12 | 194 | 433 | -10 | 144 | -256 | -284 |
| 2008 | 109 | -2 | 331 | -67 | 61 | 34 | 58 | -95 | 287 | 30 | -49 | -10 |
| 2009 | -77 | 102 | 83 | 39 | 62 | -243 | -55 | 57 | 96 | 75 | -35 | 402 |
| 2010 | 454 | 45 | 753 | -53 | -4 | -312 | -348 | 102 | -190 | 85 | 138 | 95 |
| 2011 | 367 | 533 | 59 | -71 | 384 | -80 | -770 | 503 | -407 | 19 | 204 | -211 |
| 2012 | 865 | 619 | -259 | 360 | -144 | -435 | -472 | -421 | 231 | -71 | 196 | -404 |
| 2013 | 73 | 9 | -251 | -2 | 71 | -156 | 658 | -261 | -211 | 108 | 425 | 139 |
| 2014 | -51 | 38 | -249 | 300 | 238 | 71 | 100 | -939 | 32 | 33 | 306 | 323 |
| 2015 | 293 | 269 | 179 | -209 | -153 | -362 | 1 | 262 | 252 | -450 | 483 | 502 |
| 2016 | -98 | -5 | -274 | 736 | -446 | 538 | -658 | -154 | 14 | 152 | -317 | 626 |
| 2017 | 835 | -587 | 950 | -406 | -700 | 174 | -267 | -347 | 299 | -98 | 144 | -241 |
| 2018 | 732 | 211 | -241 | 422 | -73 | -263 | -141 | -418 | 1,000 | -666 | 895 | -151 |
| 2019 | 1,296 | -648 | -965 | 324 | -187 | -562 | 153 | 500 | 41 | -254 | -182 | -626 |
| 2020 | 217 | 392 | 777 | 362 | -661 | -683 | -193 | -646 | -659 | 228 | 524 | 178 |
| 2021 | 762 | 411 | -92 | -50 | -943 | -236 | 166 | -1,086 | 325 | 35 | 351 | 526 |
| 2022 | 593 | 255 | 501 | -959 | 342 | -250 | -248 | -524 | -460 | -71 | 1,134 | 175 |
| 2023 | 311 | 341 | 263 | -416 | -342 | -580 | 96 | 127 | -77 | -449 | 918 | 295 |
| 2024 | 80 | |||||||||||
| - = No Data Reported; -- = Not Applicable; NA = Not Available; W = Withheld to avoid disclosure of individual company data. |
| Release Date: 3/29/2024 |
| Next Release Date: 4/30/2024 |