|
Download Data (XLS File) |
|
||||||||
|
||||||||
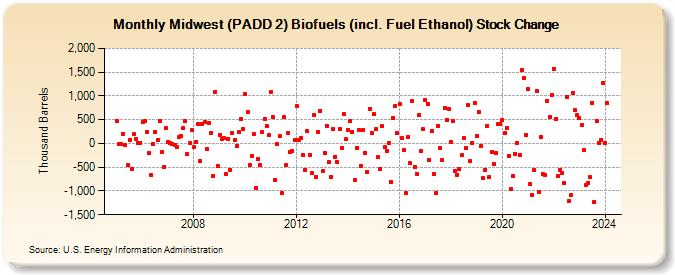
| Midwest (PADD 2) Biofuels (incl. Fuel Ethanol) Stock Change (Thousand Barrels) | ||||||||
| Year | Jan | Feb | Mar | Apr | May | Jun | Jul | Aug | Sep | Oct | Nov | Dec |
|---|---|---|---|---|---|---|---|---|---|---|---|---|
| 2005 | 479 | -14 | -5 | 201 | -36 | -452 | 77 | -531 | 189 | 88 | 13 | 19 |
| 2006 | 450 | 480 | 237 | -206 | -667 | -14 | 250 | 72 | 481 | -179 | -493 | 318 |
| 2007 | 24 | 0 | -11 | -26 | -68 | 144 | 165 | 322 | 474 | -222 | 2 | 281 |
| 2008 | -82 | 39 | 403 | -365 | 411 | 442 | -126 | 420 | 226 | -687 | 1,091 | -465 |
| 2009 | 174 | 88 | 109 | -651 | 98 | -553 | 224 | 71 | -53 | 232 | 514 | 309 |
| 2010 | 1,033 | 657 | -449 | -255 | 192 | -936 | -338 | -461 | 244 | 513 | 373 | 177 |
| 2011 | 1,079 | 557 | -766 | -15 | 155 | -1,047 | 554 | -454 | 214 | -184 | -155 | 72 |
| 2012 | 792 | 82 | 117 | -247 | -557 | 256 | -235 | -628 | 599 | -697 | 243 | 688 |
| 2013 | -588 | -203 | 373 | -400 | -704 | 297 | -275 | -398 | 300 | -87 | 620 | 84 |
| 2014 | 290 | 476 | 243 | -780 | -96 | 282 | -466 | 282 | -194 | -604 | 726 | 219 |
| 2015 | 623 | 303 | -291 | -535 | 357 | -73 | -164 | 7 | -812 | 533 | 797 | 225 |
| 2016 | 840 | 116 | -145 | -1,048 | 145 | -416 | 895 | -496 | -640 | 602 | -158 | 297 |
| 2017 | 904 | 840 | -358 | 256 | -637 | -1,041 | 363 | -106 | -348 | 741 | 487 | 718 |
| 2018 | 39 | 472 | -575 | -663 | -530 | -253 | 110 | -91 | 799 | -370 | 19 | 854 |
| 2019 | 152 | 659 | -56 | -734 | -550 | 375 | -711 | -188 | -433 | -198 | 400 | 412 |
| 2020 | 488 | 212 | 328 | -254 | -949 | -694 | -217 | 15 | -252 | 1,549 | 1,372 | 174 |
| 2021 | 1,139 | -852 | -1,076 | -564 | 1,105 | -1,016 | 127 | -633 | -673 | 901 | 559 | 1,022 |
| 2022 | 1,567 | 519 | -692 | -549 | -613 | -838 | 985 | -1,216 | -1,091 | 1,068 | 694 | 606 |
| 2023 | 534 | 384 | -131 | -874 | -828 | -708 | 860 | -1,225 | 470 | 4 | 70 | 1,280 |
| 2024 | 3 | |||||||||||
| - = No Data Reported; -- = Not Applicable; NA = Not Available; W = Withheld to avoid disclosure of individual company data. |
| Release Date: 3/29/2024 |
| Next Release Date: 4/30/2024 |