|
Download Data (XLS File) |
|
||||||||
|
||||||||
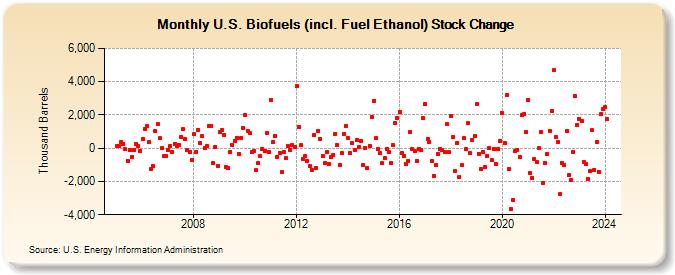
| U.S. Biofuels (incl. Fuel Ethanol) Stock Change (Thousand Barrels) | ||||||||
| Year | Jan | Feb | Mar | Apr | May | Jun | Jul | Aug | Sep | Oct | Nov | Dec |
|---|---|---|---|---|---|---|---|---|---|---|---|---|
| 2005 | 140 | 119 | 344 | 256 | -51 | -746 | -138 | -528 | -81 | 274 | 132 | -160 |
| 2006 | 536 | 1,169 | 1,358 | 364 | -1,223 | -1,092 | 1,031 | 1,427 | 592 | -2 | -491 | -472 |
| 2007 | -104 | 109 | -226 | 268 | 159 | 205 | 695 | 1,145 | 544 | -106 | -231 | -683 |
| 2008 | 848 | -210 | 1,115 | 284 | 725 | 26 | 125 | 1,323 | 1,339 | -896 | 72 | -1,060 |
| 2009 | 952 | 1,080 | 818 | -1,122 | -1,181 | -218 | 179 | 448 | 628 | -324 | 623 | 1,196 |
| 2010 | 1,995 | 1,036 | 943 | -228 | -184 | -1,334 | -894 | -488 | -32 | -191 | 898 | -213 |
| 2011 | 2,924 | 391 | 741 | -501 | -288 | -1,445 | -205 | -579 | 126 | -80 | 182 | 65 |
| 2012 | 3,736 | 1,302 | 189 | -644 | -488 | -758 | -1,101 | -1,294 | 788 | -1,171 | 1,048 | 577 |
| 2013 | -449 | -882 | -201 | -943 | -556 | -409 | 872 | 179 | -1,007 | -317 | 878 | 1,332 |
| 2014 | 612 | -312 | 291 | -127 | 474 | 73 | 446 | -1,012 | 26 | -1,196 | 142 | 1,880 |
| 2015 | 2,862 | 603 | -37 | -262 | -918 | -584 | -53 | -230 | -909 | 176 | 1,493 | 1,810 |
| 2016 | 2,193 | -301 | -499 | -937 | -795 | 998 | -49 | -156 | -752 | -26 | -127 | 1,788 |
| 2017 | 2,632 | 580 | 398 | -788 | -1,672 | -1,024 | -333 | -62 | -125 | -206 | 1,429 | -250 |
| 2018 | 1,961 | 651 | -1,344 | 338 | -1,754 | -1,040 | 584 | -53 | 1,490 | -275 | 495 | 716 |
| 2019 | 2,629 | -327 | -1,268 | -206 | -1,135 | -465 | -17 | -729 | -22 | -938 | -34 | 451 |
| 2020 | 2,117 | 316 | 3,179 | -1,274 | -3,646 | -3,120 | -159 | -88 | -507 | 1,994 | 2,046 | 985 |
| 2021 | 2,903 | -1,515 | -1,781 | -676 | -835 | -18 | 1,003 | -2,100 | -915 | -331 | 1,046 | 2,234 |
| 2022 | 4,680 | 679 | 372 | -2,763 | -871 | -1,034 | 1,055 | -1,640 | -1,895 | -217 | 3,115 | 1,402 |
| 2023 | 1,752 | 1,619 | -817 | -971 | -1,832 | -1,398 | 1,076 | -1,293 | 386 | -1,420 | 2,028 | 2,355 |
| 2024 | 2,450 | |||||||||||
| - = No Data Reported; -- = Not Applicable; NA = Not Available; W = Withheld to avoid disclosure of individual company data. |
| Release Date: 3/29/2024 |
| Next Release Date: 4/30/2024 |