|
Download Data (XLS File) |
|
||||||||
|
||||||||
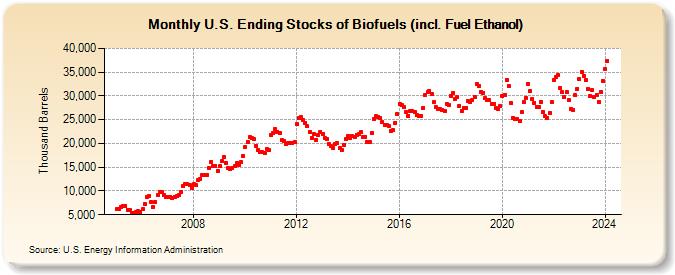
| U.S. Ending Stocks of Biofuels (incl. Fuel Ethanol) (Thousand Barrels) | ||||||||
| Year | Jan | Feb | Mar | Apr | May | Jun | Jul | Aug | Sep | Oct | Nov | Dec |
|---|---|---|---|---|---|---|---|---|---|---|---|---|
| 2005 | 6,142 | 6,261 | 6,605 | 6,861 | 6,810 | 6,064 | 5,926 | 5,398 | 5,317 | 5,591 | 5,723 | 5,563 |
| 2006 | 6,099 | 7,268 | 8,626 | 8,990 | 7,767 | 6,675 | 7,706 | 9,133 | 9,725 | 9,723 | 9,232 | 8,760 |
| 2007 | 8,656 | 8,765 | 8,539 | 8,807 | 8,966 | 9,171 | 9,866 | 11,011 | 11,555 | 11,449 | 11,218 | 10,535 |
| 2008 | 11,383 | 11,173 | 12,288 | 12,572 | 13,297 | 13,323 | 13,448 | 14,771 | 16,110 | 15,214 | 15,286 | 14,226 |
| 2009 | 15,178 | 16,258 | 17,076 | 15,954 | 14,773 | 14,555 | 14,734 | 15,182 | 15,810 | 15,486 | 16,109 | 17,305 |
| 2010 | 19,300 | 20,336 | 21,279 | 21,051 | 20,867 | 19,533 | 18,639 | 18,151 | 18,119 | 17,928 | 18,826 | 18,613 |
| 2011 | 21,842 | 22,233 | 22,974 | 22,473 | 22,185 | 20,741 | 20,536 | 19,957 | 20,082 | 20,003 | 20,185 | 20,250 |
| 2012 | 23,985 | 25,288 | 25,476 | 24,833 | 24,345 | 23,587 | 22,486 | 21,191 | 21,980 | 20,809 | 21,857 | 22,433 |
| 2013 | 21,984 | 21,102 | 20,901 | 19,958 | 19,402 | 18,993 | 19,865 | 20,044 | 19,037 | 18,720 | 19,598 | 20,930 |
| 2014 | 21,541 | 21,229 | 21,520 | 21,393 | 21,867 | 21,940 | 22,386 | 21,375 | 21,400 | 20,205 | 20,346 | 22,227 |
| 2015 | 25,088 | 25,692 | 25,654 | 25,392 | 24,473 | 23,889 | 23,836 | 23,606 | 22,697 | 22,874 | 24,367 | 26,177 |
| 2016 | 28,370 | 28,069 | 27,570 | 26,632 | 25,838 | 26,836 | 26,787 | 26,630 | 25,878 | 25,852 | 25,725 | 27,514 |
| 2017 | 30,145 | 30,725 | 31,123 | 30,336 | 28,664 | 27,639 | 27,306 | 27,244 | 27,119 | 26,913 | 28,342 | 28,092 |
| 2018 | 30,053 | 30,704 | 29,360 | 29,698 | 27,944 | 26,904 | 27,487 | 27,435 | 28,925 | 28,650 | 29,145 | 29,861 |
| 2019 | 32,490 | 32,163 | 30,895 | 30,689 | 29,554 | 29,088 | 29,072 | 28,343 | 28,321 | 27,383 | 27,349 | 27,800 |
| 2020 | 29,916 | 30,233 | 33,412 | 32,138 | 28,492 | 25,372 | 25,213 | 25,125 | 24,618 | 26,612 | 28,658 | 29,643 |
| 2021 | 32,546 | 31,031 | 29,251 | 28,574 | 27,740 | 27,722 | 28,725 | 26,625 | 25,711 | 25,379 | 26,425 | 28,659 |
| 2022 | 33,338 | 34,017 | 34,389 | 31,627 | 30,756 | 29,721 | 30,776 | 29,135 | 27,240 | 27,024 | 30,138 | 31,540 |
| 2023 | 33,466 | 35,085 | 34,268 | 33,297 | 31,465 | 30,067 | 31,143 | 29,850 | 30,236 | 28,816 | 30,844 | 33,199 |
| 2024 | 35,649 | |||||||||||
| - = No Data Reported; -- = Not Applicable; NA = Not Available; W = Withheld to avoid disclosure of individual company data. |
| Release Date: 3/29/2024 |
| Next Release Date: 4/30/2024 |