|
Download Data (XLS File) |
|
||||||||
|
||||||||
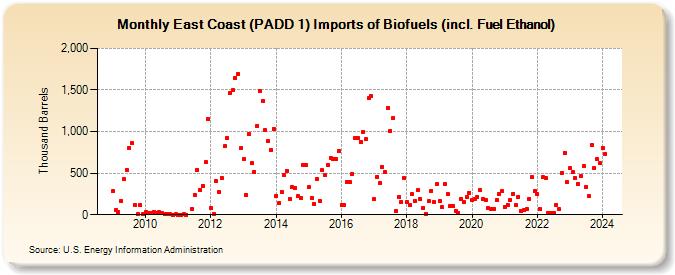
| East Coast (PADD 1) Imports of Biofuels (incl. Fuel Ethanol) (Thousand Barrels) | ||||||||
| Year | Jan | Feb | Mar | Apr | May | Jun | Jul | Aug | Sep | Oct | Nov | Dec |
|---|---|---|---|---|---|---|---|---|---|---|---|---|
| 2009 | 280 | 55 | 31 | 166 | 425 | 543 | 805 | 858 | 116 | 5 | 112 | 6 |
| 2010 | 30 | 18 | 17 | 37 | 26 | 27 | 15 | 11 | 7 | 3 | 2 | 3 |
| 2011 | 1 | 1 | 3 | 2 | 73 | 242 | 539 | 296 | 351 | 629 | 1,149 | |
| 2012 | 83 | 7 | 401 | 276 | 439 | 821 | 920 | 1,462 | 1,495 | 1,646 | 1,695 | 799 |
| 2013 | 671 | 240 | 970 | 619 | 519 | 1,071 | 1,485 | 1,362 | 1,014 | 885 | 776 | 1,033 |
| 2014 | 230 | 136 | 278 | 472 | 529 | 194 | 336 | 327 | 224 | 199 | 595 | 594 |
| 2015 | 333 | 201 | 134 | 435 | 166 | 534 | 477 | 601 | 686 | 669 | 667 | 769 |
| 2016 | 118 | 121 | 391 | 389 | 490 | 918 | 920 | 878 | 993 | 907 | 1,401 | 1,427 |
| 2017 | 183 | 455 | 379 | 574 | 510 | 1,284 | 1,004 | 1,164 | 42 | 207 | 150 | 445 |
| 2018 | 152 | 118 | 247 | 170 | 294 | 188 | 84 | 10 | 159 | 289 | 155 | 364 |
| 2019 | 164 | 89 | 367 | 252 | 109 | 103 | 49 | 23 | 189 | 151 | 216 | 266 |
| 2020 | 172 | 193 | 217 | 297 | 186 | 178 | 76 | 67 | 71 | 177 | 255 | 280 |
| 2021 | 97 | 120 | 179 | 252 | 116 | 219 | 50 | 54 | 65 | 194 | 453 | 288 |
| 2022 | 247 | 66 | 449 | 446 | 26 | 21 | 16 | 122 | 65 | 506 | 746 | 390 |
| 2023 | 561 | 510 | 441 | 374 | 471 | 581 | 337 | 221 | 841 | 558 | 664 | 621 |
| 2024 | 808 | 733 | 330 | 776 | 396 | 411 | ||||||
| - = No Data Reported; -- = Not Applicable; NA = Not Available; W = Withheld to avoid disclosure of individual company data. |
| Release Date: 8/30/2024 |
| Next Release Date: 9/30/2024 |