|
Download Data (XLS File) |
|
||||||||
|
||||||||
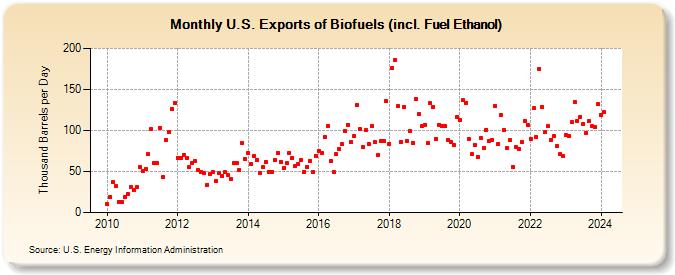
| U.S. Exports of Biofuels (incl. Fuel Ethanol) (Thousand Barrels per Day) | ||||||||
| Year | Jan | Feb | Mar | Apr | May | Jun | Jul | Aug | Sep | Oct | Nov | Dec |
|---|---|---|---|---|---|---|---|---|---|---|---|---|
| 2010 | 10 | 19 | 37 | 32 | 13 | 13 | 19 | 23 | 31 | 27 | 31 | 55 |
| 2011 | 51 | 53 | 71 | 102 | 60 | 60 | 103 | 43 | 89 | 98 | 126 | 134 |
| 2012 | 67 | 66 | 70 | 67 | 55 | 60 | 63 | 52 | 50 | 48 | 34 | 47 |
| 2013 | 49 | 38 | 48 | 45 | 49 | 46 | 41 | 60 | 60 | 52 | 85 | 65 |
| 2014 | 72 | 59 | 69 | 64 | 48 | 55 | 62 | 50 | 50 | 64 | 73 | 62 |
| 2015 | 54 | 60 | 73 | 67 | 57 | 59 | 64 | 50 | 56 | 63 | 50 | 69 |
| 2016 | 75 | 72 | 92 | 106 | 63 | 50 | 71 | 78 | 83 | 99 | 107 | 86 |
| 2017 | 93 | 131 | 102 | 80 | 100 | 84 | 106 | 86 | 70 | 87 | 87 | 136 |
| 2018 | 84 | 176 | 186 | 130 | 86 | 129 | 87 | 99 | 85 | 138 | 120 | 105 |
| 2019 | 107 | 85 | 133 | 129 | 90 | 107 | 105 | 105 | 89 | 86 | 82 | 116 |
| 2020 | 113 | 137 | 134 | 90 | 71 | 82 | 68 | 91 | 79 | 101 | 87 | 89 |
| 2021 | 130 | 84 | 119 | 100 | 79 | 88 | 56 | 80 | 78 | 86 | 112 | 107 |
| 2022 | 90 | 127 | 92 | 175 | 129 | 98 | 105 | 89 | 93 | 81 | 71 | 69 |
| 2023 | 94 | 93 | 110 | 135 | 112 | 117 | 108 | 97 | 111 | 105 | 104 | 132 |
| 2024 | 119 | |||||||||||
| - = No Data Reported; -- = Not Applicable; NA = Not Available; W = Withheld to avoid disclosure of individual company data. |
| Release Date: 3/29/2024 |
| Next Release Date: 4/30/2024 |