|
Download Data (XLS File) |
|
||||||||
|
||||||||
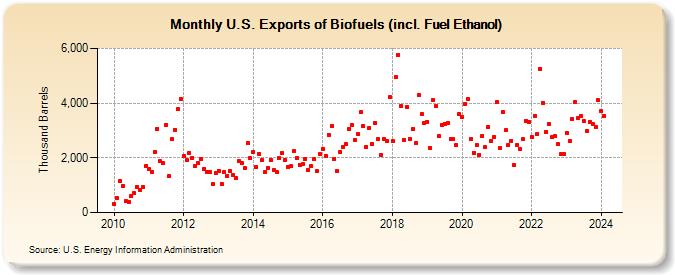
| U.S. Exports of Biofuels (incl. Fuel Ethanol) (Thousand Barrels) | ||||||||
| Year | Jan | Feb | Mar | Apr | May | Jun | Jul | Aug | Sep | Oct | Nov | Dec |
|---|---|---|---|---|---|---|---|---|---|---|---|---|
| 2010 | 324 | 519 | 1,153 | 973 | 414 | 387 | 603 | 707 | 929 | 834 | 930 | 1,717 |
| 2011 | 1,591 | 1,496 | 2,209 | 3,070 | 1,871 | 1,800 | 3,205 | 1,321 | 2,684 | 3,031 | 3,771 | 4,158 |
| 2012 | 2,077 | 1,909 | 2,181 | 2,005 | 1,717 | 1,802 | 1,946 | 1,609 | 1,485 | 1,493 | 1,030 | 1,456 |
| 2013 | 1,534 | 1,054 | 1,488 | 1,338 | 1,515 | 1,383 | 1,259 | 1,869 | 1,810 | 1,621 | 2,542 | 2,000 |
| 2014 | 2,225 | 1,658 | 2,150 | 1,921 | 1,473 | 1,642 | 1,920 | 1,556 | 1,490 | 1,989 | 2,179 | 1,922 |
| 2015 | 1,662 | 1,685 | 2,248 | 2,002 | 1,752 | 1,759 | 1,971 | 1,547 | 1,692 | 1,953 | 1,503 | 2,128 |
| 2016 | 2,339 | 2,076 | 2,847 | 3,167 | 1,963 | 1,515 | 2,205 | 2,413 | 2,496 | 3,060 | 3,217 | 2,663 |
| 2017 | 2,886 | 3,664 | 3,159 | 2,399 | 3,101 | 2,523 | 3,274 | 2,672 | 2,111 | 2,706 | 2,614 | 4,210 |
| 2018 | 2,606 | 4,941 | 5,773 | 3,893 | 2,659 | 3,860 | 2,698 | 3,061 | 2,539 | 4,282 | 3,608 | 3,256 |
| 2019 | 3,328 | 2,374 | 4,130 | 3,878 | 2,796 | 3,214 | 3,247 | 3,267 | 2,677 | 2,678 | 2,474 | 3,586 |
| 2020 | 3,490 | 3,982 | 4,140 | 2,706 | 2,187 | 2,473 | 2,121 | 2,811 | 2,384 | 3,137 | 2,619 | 2,768 |
| 2021 | 4,041 | 2,349 | 3,676 | 3,002 | 2,461 | 2,626 | 1,733 | 2,478 | 2,327 | 2,671 | 3,356 | 3,313 |
| 2022 | 2,777 | 3,544 | 2,864 | 5,261 | 4,014 | 2,949 | 3,240 | 2,745 | 2,785 | 2,504 | 2,135 | 2,130 |
| 2023 | 2,904 | 2,615 | 3,418 | 4,044 | 3,462 | 3,513 | 3,355 | 2,995 | 3,326 | 3,247 | 3,128 | 4,104 |
| 2024 | 3,702 | |||||||||||
| - = No Data Reported; -- = Not Applicable; NA = Not Available; W = Withheld to avoid disclosure of individual company data. |
| Release Date: 3/29/2024 |
| Next Release Date: 4/30/2024 |