|
Download Data (XLS File) |
|
||||||||
|
||||||||
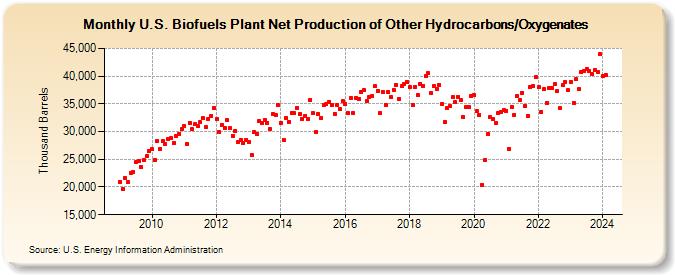
| U.S. Biofuels Plant Net Production of Other Hydrocarbons/Oxygenates (Thousand Barrels) | ||||||||
| Year | Jan | Feb | Mar | Apr | May | Jun | Jul | Aug | Sep | Oct | Nov | Dec |
|---|---|---|---|---|---|---|---|---|---|---|---|---|
| 2009 | 20,949 | 19,608 | 21,647 | 20,859 | 22,602 | 22,686 | 24,453 | 24,756 | 23,604 | 24,847 | 25,505 | 26,538 |
| 2010 | 26,778 | 24,958 | 28,295 | 26,856 | 28,210 | 27,683 | 28,632 | 28,786 | 27,970 | 29,221 | 29,607 | 30,398 |
| 2011 | 31,026 | 27,749 | 31,596 | 30,376 | 31,316 | 30,980 | 31,664 | 32,420 | 30,859 | 32,264 | 32,863 | 34,249 |
| 2012 | 32,263 | 29,922 | 31,249 | 30,566 | 32,035 | 30,588 | 29,278 | 30,112 | 28,102 | 28,464 | 27,925 | 28,547 |
| 2013 | 28,137 | 25,804 | 29,961 | 29,647 | 31,887 | 31,517 | 32,168 | 31,617 | 30,446 | 33,136 | 33,031 | 34,726 |
| 2014 | 31,591 | 28,507 | 32,358 | 31,756 | 33,338 | 33,261 | 34,283 | 33,102 | 32,291 | 32,863 | 32,315 | 35,755 |
| 2015 | 33,297 | 29,876 | 33,182 | 32,482 | 34,866 | 34,958 | 35,384 | 34,718 | 33,231 | 34,778 | 34,093 | 35,461 |
| 2016 | 34,990 | 33,311 | 36,124 | 33,379 | 36,111 | 35,959 | 37,164 | 37,444 | 35,549 | 36,320 | 36,406 | 38,167 |
| 2017 | 37,392 | 33,388 | 37,159 | 34,811 | 37,120 | 36,266 | 37,557 | 38,446 | 35,936 | 38,178 | 38,553 | 38,981 |
| 2018 | 38,018 | 34,824 | 38,108 | 36,622 | 38,627 | 38,263 | 39,976 | 40,497 | 36,879 | 38,255 | 37,682 | 38,411 |
| 2019 | 35,030 | 31,707 | 34,216 | 34,604 | 36,147 | 35,268 | 36,317 | 35,633 | 32,609 | 34,377 | 34,392 | 36,438 |
| 2020 | 36,542 | 33,650 | 33,003 | 20,425 | 24,787 | 29,549 | 32,557 | 32,292 | 31,569 | 33,357 | 33,535 | 33,869 |
| 2021 | 33,756 | 26,913 | 34,433 | 33,047 | 36,461 | 35,617 | 37,015 | 34,585 | 32,827 | 37,967 | 38,225 | 39,774 |
| 2022 | 37,988 | 33,616 | 37,616 | 35,137 | 37,841 | 37,866 | 38,512 | 37,318 | 34,159 | 38,462 | 38,932 | 37,436 |
| 2023 | 38,988 | 35,186 | 39,389 | 37,632 | 40,680 | 40,880 | 41,200 | 40,913 | 40,297 | 41,097 | 40,753 | 43,961 |
| 2024 | 39,946 | |||||||||||
| - = No Data Reported; -- = Not Applicable; NA = Not Available; W = Withheld to avoid disclosure of individual company data. |
| Release Date: 3/29/2024 |
| Next Release Date: 4/30/2024 |