|
Download Data (XLS File) |
|
||||||||
|
||||||||
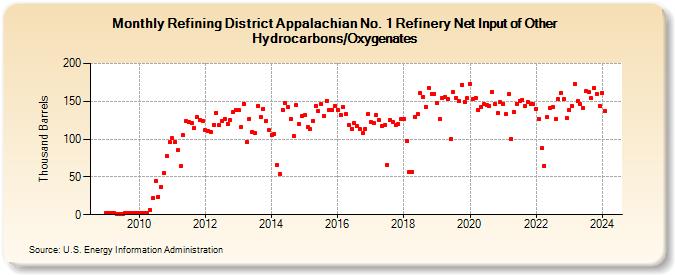
| Refining District Appalachian No. 1 Refinery Net Input of Other Hydrocarbons/Oxygenates (Thousand Barrels) | ||||||||
| Year | Jan | Feb | Mar | Apr | May | Jun | Jul | Aug | Sep | Oct | Nov | Dec |
|---|---|---|---|---|---|---|---|---|---|---|---|---|
| 2009 | 2 | 2 | 2 | 2 | 1 | 1 | 1 | 2 | 2 | 2 | 2 | 2 |
| 2010 | 2 | 2 | 2 | 2 | 6 | 22 | 45 | 24 | 37 | 55 | 77 | 96 |
| 2011 | 101 | 96 | 85 | 64 | 105 | 124 | 122 | 121 | 115 | 129 | 125 | 124 |
| 2012 | 112 | 111 | 109 | 119 | 135 | 118 | 124 | 127 | 120 | 125 | 136 | 138 |
| 2013 | 138 | 116 | 147 | 96 | 127 | 110 | 108 | 144 | 129 | 140 | 124 | 112 |
| 2014 | 106 | 107 | 66 | 54 | 139 | 148 | 142 | 127 | 104 | 145 | 120 | 130 |
| 2015 | 132 | 116 | 113 | 124 | 144 | 137 | 146 | 131 | 151 | 138 | 138 | 144 |
| 2016 | 139 | 132 | 142 | 133 | 119 | 114 | 121 | 117 | 113 | 108 | 114 | 133 |
| 2017 | 122 | 121 | 132 | 125 | 117 | 118 | 66 | 125 | 122 | 119 | 120 | 126 |
| 2018 | 127 | 98 | 57 | 56 | 129 | 133 | 161 | 156 | 143 | 168 | 160 | 160 |
| 2019 | 148 | 126 | 155 | 156 | 153 | 100 | 162 | 155 | 150 | 172 | 149 | 154 |
| 2020 | 173 | 153 | 155 | 138 | 142 | 146 | 145 | 144 | 162 | 146 | 134 | 149 |
| 2021 | 147 | 133 | 159 | 100 | 136 | 147 | 151 | 152 | 144 | 149 | 147 | 146 |
| 2022 | 140 | 126 | 88 | 65 | 129 | 141 | 142 | 126 | 153 | 161 | 153 | 128 |
| 2023 | 139 | 144 | 173 | 150 | 146 | 141 | 163 | 162 | 154 | 168 | 160 | 144 |
| 2024 | 161 | |||||||||||
| - = No Data Reported; -- = Not Applicable; NA = Not Available; W = Withheld to avoid disclosure of individual company data. |
| Release Date: 3/29/2024 |
| Next Release Date: 4/30/2024 |