|
Download Data (XLS File) |
|
||||||||
|
||||||||
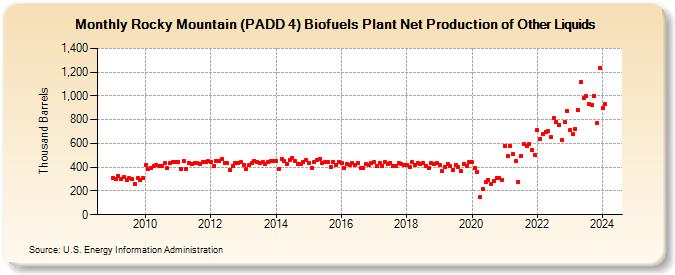
| Rocky Mountain (PADD 4) Biofuels Plant Net Production of Other Liquids (Thousand Barrels) | ||||||||
| Year | Jan | Feb | Mar | Apr | May | Jun | Jul | Aug | Sep | Oct | Nov | Dec |
|---|---|---|---|---|---|---|---|---|---|---|---|---|
| 2009 | 313 | 298 | 326 | 299 | 319 | 292 | 306 | 301 | 261 | 305 | 292 | 306 |
| 2010 | 419 | 383 | 395 | 411 | 415 | 410 | 414 | 434 | 390 | 437 | 440 | 441 |
| 2011 | 446 | 387 | 448 | 388 | 436 | 430 | 439 | 432 | 430 | 440 | 447 | 449 |
| 2012 | 444 | 410 | 454 | 452 | 468 | 437 | 433 | 375 | 410 | 438 | 436 | 442 |
| 2013 | 422 | 386 | 422 | 435 | 455 | 443 | 436 | 442 | 425 | 442 | 455 | 453 |
| 2014 | 452 | 389 | 469 | 452 | 427 | 463 | 478 | 449 | 426 | 427 | 441 | 461 |
| 2015 | 435 | 397 | 445 | 457 | 472 | 433 | 446 | 446 | 398 | 447 | 422 | 446 |
| 2016 | 435 | 395 | 426 | 415 | 435 | 422 | 432 | 395 | 393 | 428 | 418 | 434 |
| 2017 | 445 | 410 | 433 | 413 | 442 | 431 | 436 | 413 | 411 | 434 | 431 | 421 |
| 2018 | 421 | 401 | 440 | 422 | 432 | 425 | 439 | 413 | 396 | 434 | 431 | 436 |
| 2019 | 416 | 366 | 400 | 423 | 406 | 380 | 419 | 399 | 366 | 429 | 414 | 440 |
| 2020 | 440 | 391 | 359 | 149 | 219 | 277 | 294 | 257 | 282 | 311 | 305 | 292 |
| 2021 | 579 | 492 | 582 | 507 | 449 | 276 | 493 | 593 | 580 | 594 | 543 | 504 |
| 2022 | 715 | 639 | 682 | 700 | 701 | 650 | 810 | 782 | 754 | 626 | 782 | 873 |
| 2023 | 714 | 680 | 724 | 885 | 1,117 | 979 | 997 | 933 | 926 | 1,001 | 769 | 1,231 |
| 2024 | 900 | |||||||||||
| - = No Data Reported; -- = Not Applicable; NA = Not Available; W = Withheld to avoid disclosure of individual company data. |
| Release Date: 3/29/2024 |
| Next Release Date: 4/30/2024 |