|
Download Data (XLS File) |
|
||||||||
|
||||||||
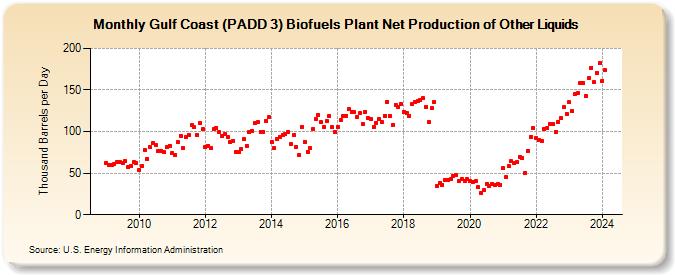
| Gulf Coast (PADD 3) Biofuels Plant Net Production of Other Liquids (Thousand Barrels per Day) | ||||||||
| Year | Jan | Feb | Mar | Apr | May | Jun | Jul | Aug | Sep | Oct | Nov | Dec |
|---|---|---|---|---|---|---|---|---|---|---|---|---|
| 2009 | 62 | 60 | 60 | 61 | 63 | 63 | 62 | 64 | 57 | 59 | 63 | 62 |
| 2010 | 54 | 59 | 78 | 67 | 81 | 86 | 84 | 77 | 77 | 75 | 81 | 83 |
| 2011 | 74 | 72 | 87 | 95 | 80 | 93 | 96 | 108 | 105 | 96 | 110 | 103 |
| 2012 | 81 | 83 | 80 | 103 | 104 | 99 | 95 | 97 | 94 | 87 | 89 | 75 |
| 2013 | 75 | 79 | 91 | 83 | 99 | 101 | 110 | 111 | 100 | 100 | 113 | 117 |
| 2014 | 88 | 80 | 91 | 94 | 96 | 97 | 100 | 85 | 96 | 82 | 72 | 106 |
| 2015 | 88 | 76 | 80 | 103 | 115 | 120 | 111 | 105 | 113 | 119 | 105 | 100 |
| 2016 | 106 | 114 | 119 | 119 | 127 | 123 | 123 | 118 | 122 | 109 | 124 | 116 |
| 2017 | 115 | 106 | 110 | 115 | 111 | 119 | 136 | 119 | 108 | 132 | 130 | 133 |
| 2018 | 124 | 122 | 119 | 133 | 135 | 137 | 138 | 140 | 130 | 111 | 128 | 136 |
| 2019 | 35 | 38 | 36 | 42 | 42 | 43 | 47 | 48 | 41 | 43 | 40 | 43 |
| 2020 | 40 | 39 | 40 | 33 | 26 | 30 | 37 | 35 | 37 | 36 | 37 | 36 |
| 2021 | 56 | 45 | 58 | 64 | 62 | 63 | 70 | 68 | 50 | 77 | 94 | 104 |
| 2022 | 92 | 90 | 89 | 103 | 104 | 109 | 109 | 100 | 112 | 116 | 129 | 121 |
| 2023 | 135 | 125 | 145 | 146 | 158 | 158 | 143 | 164 | 177 | 159 | 171 | 182 |
| 2024 | 161 | |||||||||||
| - = No Data Reported; -- = Not Applicable; NA = Not Available; W = Withheld to avoid disclosure of individual company data. |
| Release Date: 3/29/2024 |
| Next Release Date: 4/30/2024 |