|
Download Data (XLS File) |
|
||||||||
|
||||||||
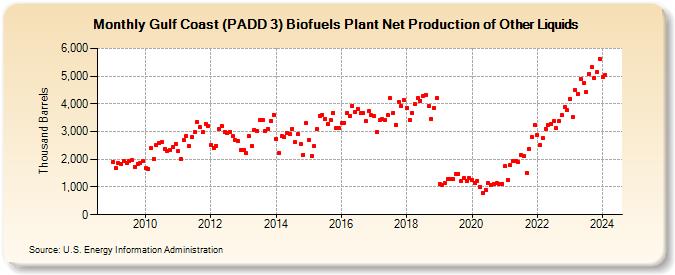
| Gulf Coast (PADD 3) Biofuels Plant Net Production of Other Liquids (Thousand Barrels) | ||||||||
| Year | Jan | Feb | Mar | Apr | May | Jun | Jul | Aug | Sep | Oct | Nov | Dec |
|---|---|---|---|---|---|---|---|---|---|---|---|---|
| 2009 | 1,910 | 1,686 | 1,863 | 1,832 | 1,945 | 1,877 | 1,933 | 1,969 | 1,724 | 1,822 | 1,878 | 1,932 |
| 2010 | 1,670 | 1,656 | 2,406 | 2,023 | 2,497 | 2,576 | 2,619 | 2,385 | 2,310 | 2,337 | 2,427 | 2,559 |
| 2011 | 2,285 | 2,003 | 2,695 | 2,836 | 2,488 | 2,802 | 2,991 | 3,338 | 3,152 | 2,971 | 3,289 | 3,196 |
| 2012 | 2,513 | 2,403 | 2,488 | 3,091 | 3,210 | 2,975 | 2,959 | 2,999 | 2,823 | 2,686 | 2,665 | 2,337 |
| 2013 | 2,328 | 2,211 | 2,832 | 2,492 | 3,067 | 3,033 | 3,402 | 3,428 | 3,014 | 3,100 | 3,391 | 3,615 |
| 2014 | 2,726 | 2,234 | 2,823 | 2,812 | 2,961 | 2,905 | 3,102 | 2,622 | 2,894 | 2,554 | 2,172 | 3,300 |
| 2015 | 2,713 | 2,122 | 2,470 | 3,082 | 3,569 | 3,615 | 3,448 | 3,265 | 3,404 | 3,681 | 3,141 | 3,113 |
| 2016 | 3,291 | 3,317 | 3,674 | 3,572 | 3,938 | 3,703 | 3,819 | 3,655 | 3,674 | 3,370 | 3,725 | 3,587 |
| 2017 | 3,551 | 2,971 | 3,406 | 3,449 | 3,432 | 3,583 | 4,202 | 3,679 | 3,246 | 4,082 | 3,914 | 4,131 |
| 2018 | 3,857 | 3,411 | 3,676 | 3,997 | 4,193 | 4,118 | 4,267 | 4,335 | 3,909 | 3,453 | 3,851 | 4,210 |
| 2019 | 1,097 | 1,072 | 1,128 | 1,272 | 1,304 | 1,291 | 1,472 | 1,477 | 1,231 | 1,321 | 1,200 | 1,323 |
| 2020 | 1,235 | 1,133 | 1,234 | 996 | 798 | 903 | 1,144 | 1,086 | 1,118 | 1,127 | 1,102 | 1,120 |
| 2021 | 1,743 | 1,265 | 1,788 | 1,928 | 1,921 | 1,886 | 2,162 | 2,107 | 1,497 | 2,377 | 2,806 | 3,225 |
| 2022 | 2,859 | 2,520 | 2,765 | 3,099 | 3,230 | 3,271 | 3,374 | 3,112 | 3,373 | 3,590 | 3,868 | 3,763 |
| 2023 | 4,183 | 3,510 | 4,498 | 4,372 | 4,905 | 4,751 | 4,433 | 5,084 | 5,312 | 4,939 | 5,134 | 5,631 |
| 2024 | 4,978 | |||||||||||
| - = No Data Reported; -- = Not Applicable; NA = Not Available; W = Withheld to avoid disclosure of individual company data. |
| Release Date: 3/29/2024 |
| Next Release Date: 4/30/2024 |