|
Download Data (XLS File) |
|
||||||||
|
||||||||
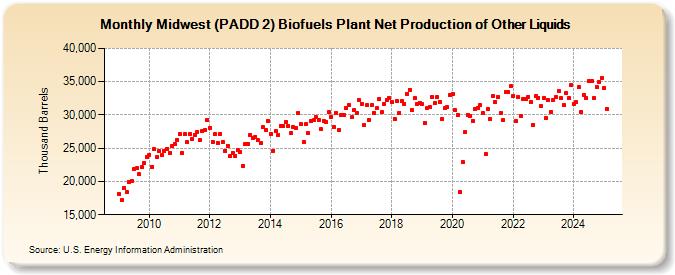
| Midwest (PADD 2) Biofuels Plant Net Production of Other Liquids (Thousand Barrels) | ||||||||
| Year | Jan | Feb | Mar | Apr | May | Jun | Jul | Aug | Sep | Oct | Nov | Dec |
|---|---|---|---|---|---|---|---|---|---|---|---|---|
| 2009 | 18,084 | 17,172 | 18,990 | 18,350 | 19,920 | 20,074 | 21,801 | 21,967 | 21,079 | 22,176 | 22,788 | 23,717 |
| 2010 | 23,993 | 22,240 | 24,824 | 23,672 | 24,512 | 23,926 | 24,598 | 24,934 | 24,318 | 25,333 | 25,696 | 26,254 |
| 2011 | 27,116 | 24,248 | 27,081 | 25,890 | 27,059 | 26,402 | 27,032 | 27,454 | 26,190 | 27,569 | 27,780 | 29,249 |
| 2012 | 28,089 | 25,957 | 27,063 | 25,751 | 27,150 | 25,922 | 24,633 | 25,388 | 23,769 | 24,283 | 23,844 | 24,780 |
| 2013 | 24,432 | 22,324 | 25,588 | 25,674 | 26,986 | 26,577 | 26,748 | 26,203 | 25,728 | 28,138 | 27,705 | 29,125 |
| 2014 | 27,171 | 24,610 | 27,534 | 27,006 | 28,389 | 28,307 | 28,921 | 28,311 | 27,245 | 28,202 | 28,047 | 30,314 |
| 2015 | 28,590 | 25,896 | 28,578 | 27,241 | 29,114 | 29,170 | 29,629 | 29,211 | 27,818 | 29,086 | 28,961 | 30,387 |
| 2016 | 29,730 | 28,147 | 30,305 | 27,719 | 30,003 | 30,014 | 31,030 | 31,483 | 29,639 | 30,697 | 30,313 | 32,178 |
| 2017 | 31,699 | 28,421 | 31,485 | 29,274 | 31,440 | 30,327 | 31,041 | 32,462 | 30,412 | 31,700 | 32,228 | 32,473 |
| 2018 | 31,895 | 29,393 | 32,088 | 30,347 | 32,063 | 31,656 | 33,219 | 33,798 | 30,809 | 32,524 | 31,654 | 31,800 |
| 2019 | 31,604 | 28,796 | 31,007 | 31,240 | 32,662 | 31,862 | 32,676 | 32,007 | 29,406 | 30,983 | 31,136 | 32,989 |
| 2020 | 33,218 | 30,665 | 29,991 | 18,450 | 22,897 | 27,391 | 30,050 | 29,846 | 29,159 | 30,898 | 31,082 | 31,423 |
| 2021 | 30,300 | 24,138 | 30,826 | 29,366 | 32,784 | 31,957 | 32,710 | 30,320 | 29,251 | 33,436 | 33,404 | 34,285 |
| 2022 | 32,917 | 29,093 | 32,693 | 29,903 | 32,415 | 32,441 | 32,751 | 31,950 | 28,554 | 32,799 | 32,585 | 31,269 |
| 2023 | 32,561 | 29,496 | 32,188 | 30,486 | 32,302 | 32,678 | 33,606 | 32,542 | 31,520 | 33,292 | 32,513 | 34,521 |
| 2024 | 31,674 | 31,910 | 34,143 | 30,510 | 33,069 | 32,519 | ||||||
| - = No Data Reported; -- = Not Applicable; NA = Not Available; W = Withheld to avoid disclosure of individual company data. |
| Release Date: 8/30/2024 |
| Next Release Date: 9/30/2024 |