|
Download Data (XLS File) |
|
||||||||
|
||||||||
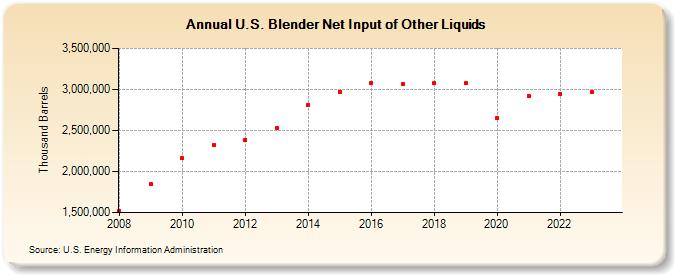
| U.S. Blender Net Input of Other Liquids (Thousand Barrels) | ||||||||
| Decade | Year-0 | Year-1 | Year-2 | Year-3 | Year-4 | Year-5 | Year-6 | Year-7 | Year-8 | Year-9 |
|---|---|---|---|---|---|---|---|---|---|---|
| 2000's | 1,518,748 | 1,844,518 | ||||||||
| 2010's | 2,160,246 | 2,323,299 | 2,388,655 | 2,527,508 | 2,810,442 | 2,972,911 | 3,075,333 | 3,063,551 | 3,073,228 | 3,075,211 |
| 2020's | 2,654,016 | 2,922,896 | 2,945,858 | 2,965,475 |
| - = No Data Reported; -- = Not Applicable; NA = Not Available; W = Withheld to avoid disclosure of individual company data. |
| Release Date: 3/29/2024 |
| Next Release Date: 8/30/2024 |
Referring Pages: