|
Download Data (XLS File) |
|
||||||||
|
||||||||
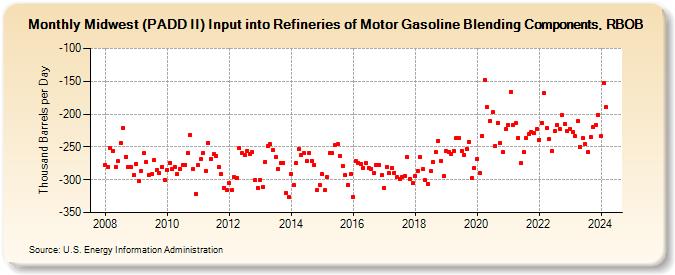
| Midwest (PADD II) Input into Refineries of Motor Gasoline Blending Components, RBOB (Thousand Barrels per Day) | ||||||||
| Year | Jan | Feb | Mar | Apr | May | Jun | Jul | Aug | Sep | Oct | Nov | Dec |
|---|---|---|---|---|---|---|---|---|---|---|---|---|
| 2008 | -277 | -280 | -252 | -257 | -281 | -272 | -244 | -221 | -265 | -281 | -281 | -293 |
| 2009 | -276 | -302 | -286 | -260 | -273 | -293 | -292 | -270 | -285 | -290 | -280 | -300 |
| 2010 | -285 | -274 | -284 | -280 | -291 | -284 | -277 | -277 | -259 | -232 | -283 | -321 |
| 2011 | -278 | -269 | -259 | -286 | -244 | -268 | -261 | -264 | -281 | -291 | -312 | -316 |
| 2012 | -305 | -316 | -296 | -297 | -252 | -260 | -262 | -256 | -261 | -258 | -301 | -312 |
| 2013 | -300 | -311 | -273 | -249 | -246 | -254 | -266 | -283 | -275 | -274 | -320 | -327 |
| 2014 | -291 | -308 | -275 | -253 | -262 | -260 | -272 | -259 | -271 | -278 | -316 | -308 |
| 2015 | -291 | -316 | -296 | -259 | -260 | -247 | -246 | -264 | -279 | -293 | -308 | -291 |
| 2016 | -327 | -272 | -274 | -276 | -282 | -275 | -282 | -283 | -290 | -278 | -277 | -293 |
| 2017 | -312 | -280 | -290 | -282 | -289 | -296 | -299 | -296 | -294 | -266 | -299 | -305 |
| 2018 | -294 | -286 | -266 | -284 | -301 | -306 | -287 | -273 | -258 | -241 | -271 | -295 |
| 2019 | -257 | -258 | -261 | -256 | -237 | -237 | -256 | -262 | -253 | -242 | -298 | -282 |
| 2020 | -268 | -289 | -233 | -148 | -190 | -210 | -197 | -249 | -213 | -244 | -258 | -223 |
| 2021 | -217 | -166 | -216 | -214 | -236 | -275 | -258 | -237 | -231 | -228 | -229 | -223 |
| 2022 | -239 | -213 | -168 | -221 | -238 | -257 | -226 | -216 | -222 | -202 | -215 | -226 |
| 2023 | -223 | -227 | -234 | -211 | -250 | -237 | -246 | -258 | -235 | -220 | -216 | -201 |
| 2024 | -234 | -152 | ||||||||||
| - = No Data Reported; -- = Not Applicable; NA = Not Available; W = Withheld to avoid disclosure of individual company data. |
| Release Date: 4/30/2024 |
| Next Release Date: 5/31/2024 |