|
Download Data (XLS File) |
|
||||||||
|
||||||||
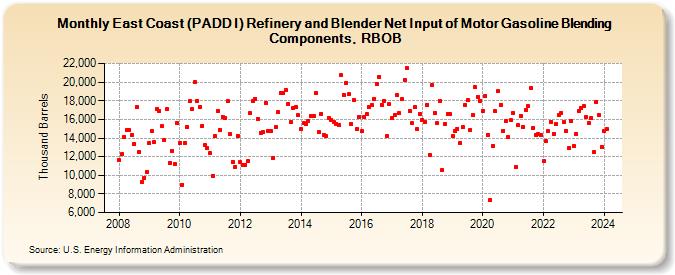
| East Coast (PADD I) Refinery and Blender Net Input of Motor Gasoline Blending Components, RBOB (Thousand Barrels) | ||||||||
| Year | Jan | Feb | Mar | Apr | May | Jun | Jul | Aug | Sep | Oct | Nov | Dec |
|---|---|---|---|---|---|---|---|---|---|---|---|---|
| 2008 | 11,605 | 12,249 | 14,157 | 14,846 | 14,866 | 14,302 | 13,396 | 17,281 | 12,522 | 9,324 | 9,756 | 10,373 |
| 2009 | 13,416 | 14,702 | 13,546 | 17,127 | 16,953 | 15,244 | 13,759 | 17,070 | 11,351 | 12,637 | 11,188 | 15,570 |
| 2010 | 13,504 | 9,010 | 13,450 | 15,182 | 17,933 | 17,102 | 19,995 | 18,020 | 17,352 | 15,327 | 13,215 | 12,903 |
| 2011 | 12,348 | 9,968 | 14,204 | 16,904 | 14,906 | 16,294 | 16,190 | 17,951 | 14,405 | 11,475 | 10,924 | 14,268 |
| 2012 | 11,421 | 11,091 | 11,151 | 11,486 | 16,638 | 18,017 | 18,231 | 16,067 | 14,585 | 14,600 | 17,782 | 14,700 |
| 2013 | 14,706 | 11,885 | 15,135 | 16,788 | 18,832 | 18,865 | 19,180 | 17,666 | 15,680 | 17,275 | 17,309 | 16,427 |
| 2014 | 14,967 | 15,599 | 15,456 | 15,850 | 16,353 | 16,312 | 18,811 | 14,596 | 16,620 | 14,329 | 14,167 | 16,172 |
| 2015 | 15,959 | 15,689 | 15,545 | 15,448 | 20,716 | 18,647 | 19,916 | 18,680 | 15,528 | 18,085 | 14,945 | 16,260 |
| 2016 | 14,724 | 16,247 | 16,547 | 17,345 | 17,498 | 18,223 | 19,827 | 20,578 | 17,525 | 18,014 | 14,196 | 17,619 |
| 2017 | 16,103 | 16,510 | 18,581 | 16,648 | 18,164 | 20,235 | 21,468 | 16,884 | 15,563 | 17,324 | 15,018 | 16,581 |
| 2018 | 15,927 | 15,719 | 17,584 | 12,212 | 19,709 | 16,728 | 15,573 | 18,002 | 10,578 | 15,540 | 16,598 | 16,528 |
| 2019 | 14,207 | 14,726 | 15,012 | 13,490 | 15,130 | 17,557 | 18,046 | 14,893 | 16,472 | 19,451 | 18,442 | 18,009 |
| 2020 | 16,953 | 18,492 | 14,369 | 7,365 | 13,171 | 16,851 | 19,005 | 17,579 | 14,803 | 15,782 | 14,122 | 15,901 |
| 2021 | 16,724 | 10,908 | 15,353 | 16,367 | 15,200 | 17,033 | 17,384 | 19,412 | 15,112 | 14,289 | 14,404 | 14,299 |
| 2022 | 11,516 | 13,641 | 14,728 | 15,738 | 14,459 | 15,505 | 16,508 | 16,690 | 15,685 | 14,783 | 12,888 | 15,844 |
| 2023 | 13,143 | 14,452 | 16,900 | 17,178 | 17,383 | 16,252 | 15,619 | 16,166 | 12,515 | 17,859 | 16,497 | 13,087 |
| 2024 | 14,736 | |||||||||||
| - = No Data Reported; -- = Not Applicable; NA = Not Available; W = Withheld to avoid disclosure of individual company data. |
| Release Date: 3/29/2024 |
| Next Release Date: 4/30/2024 |