|
Download Data (XLS File) |
|
||||||||
|
||||||||
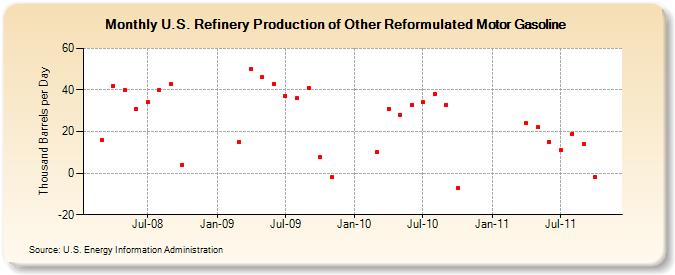
| U.S. Refinery Production of Other Reformulated Motor Gasoline (Thousand Barrels per Day) | ||||||||
| Year | Jan | Feb | Mar | Apr | May | Jun | Jul | Aug | Sep | Oct | Nov | Dec |
|---|---|---|---|---|---|---|---|---|---|---|---|---|
| 2008 | 16 | 42 | 40 | 31 | 34 | 40 | 43 | 4 | ||||
| 2009 | 15 | 50 | 46 | 43 | 37 | 36 | 41 | 8 | -2 | |||
| 2010 | 10 | 31 | 28 | 33 | 34 | 38 | 33 | -7 | ||||
| 2011 | 24 | 22 | 15 | 11 | 19 | 14 | -2 | |||||
| 2012 | 18 | 14 | 18 | 17 | 16 | 16 | -1 | |||||
| - = No Data Reported; -- = Not Applicable; NA = Not Available; W = Withheld to avoid disclosure of individual company data. |
| Release Date: 3/29/2024 |
| Next Release Date: 4/30/2024 |