|
Download Data (XLS File) |
|
||||||||
|
||||||||
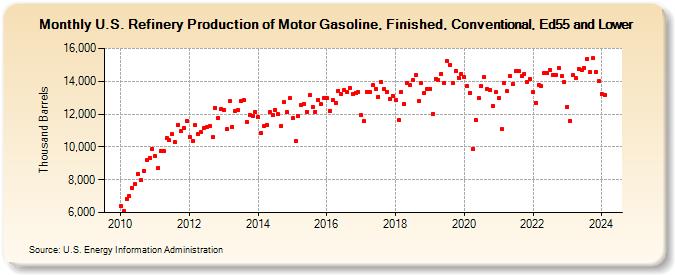
| U.S. Refinery Production of Motor Gasoline, Finished, Conventional, Ed55 and Lower (Thousand Barrels) | ||||||||
| Year | Jan | Feb | Mar | Apr | May | Jun | Jul | Aug | Sep | Oct | Nov | Dec |
|---|---|---|---|---|---|---|---|---|---|---|---|---|
| 2010 | 6,406 | 6,074 | 6,817 | 6,994 | 7,506 | 7,727 | 8,361 | 7,965 | 8,544 | 9,196 | 9,334 | 9,878 |
| 2011 | 9,438 | 8,734 | 9,744 | 9,734 | 10,533 | 10,395 | 10,761 | 10,280 | 11,358 | 10,964 | 11,141 | 11,568 |
| 2012 | 10,605 | 10,371 | 11,305 | 10,771 | 10,908 | 11,175 | 11,193 | 11,250 | 10,581 | 12,397 | 11,770 | 12,318 |
| 2013 | 12,253 | 11,087 | 12,780 | 11,226 | 12,213 | 12,244 | 12,778 | 12,828 | 11,523 | 11,946 | 11,857 | 12,130 |
| 2014 | 11,805 | 10,832 | 11,272 | 11,350 | 12,108 | 11,927 | 12,241 | 11,980 | 11,275 | 12,718 | 12,119 | 12,960 |
| 2015 | 11,746 | 10,374 | 11,899 | 12,576 | 12,620 | 12,155 | 13,147 | 12,429 | 12,142 | 12,876 | 12,593 | 12,982 |
| 2016 | 12,952 | 12,204 | 12,850 | 12,698 | 13,427 | 13,197 | 13,448 | 13,350 | 13,594 | 13,222 | 13,310 | 13,356 |
| 2017 | 11,936 | 11,558 | 13,369 | 13,337 | 13,748 | 13,550 | 13,061 | 13,979 | 13,552 | 13,367 | 12,920 | 13,120 |
| 2018 | 12,844 | 11,630 | 13,317 | 12,613 | 13,918 | 13,771 | 14,063 | 14,349 | 12,773 | 13,895 | 13,271 | 13,515 |
| 2019 | 13,549 | 12,021 | 14,158 | 14,045 | 14,447 | 13,895 | 15,206 | 14,978 | 13,921 | 14,616 | 14,221 | 14,454 |
| 2020 | 14,270 | 13,698 | 13,308 | 9,865 | 11,647 | 12,957 | 13,715 | 14,234 | 13,526 | 13,493 | 12,479 | 13,319 |
| 2021 | 12,954 | 11,077 | 13,881 | 13,391 | 14,294 | 13,845 | 14,608 | 14,599 | 14,292 | 14,443 | 13,969 | 14,106 |
| 2022 | 13,320 | 12,674 | 13,757 | 13,711 | 14,471 | 14,510 | 14,701 | 14,403 | 14,380 | 14,788 | 14,289 | 13,937 |
| 2023 | 12,449 | 11,584 | 14,389 | 14,196 | 14,717 | 14,695 | 14,833 | 15,371 | 14,561 | 15,391 | 14,563 | 14,010 |
| 2024 | 13,247 | |||||||||||
| - = No Data Reported; -- = Not Applicable; NA = Not Available; W = Withheld to avoid disclosure of individual company data. |
| Release Date: 3/29/2024 |
| Next Release Date: 4/30/2024 |