|
Download Data (XLS File) |
|
||||||||
|
||||||||
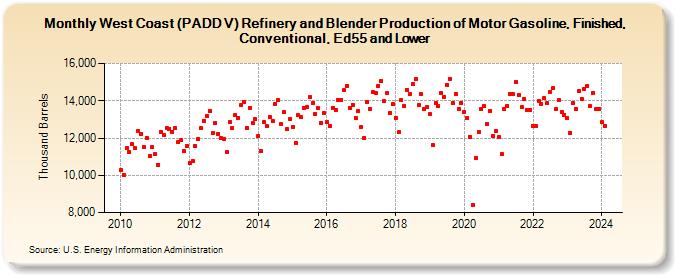
| West Coast (PADD V) Refinery and Blender Production of Motor Gasoline, Finished, Conventional, Ed55 and Lower (Thousand Barrels) | ||||||||
| Year | Jan | Feb | Mar | Apr | May | Jun | Jul | Aug | Sep | Oct | Nov | Dec |
|---|---|---|---|---|---|---|---|---|---|---|---|---|
| 2010 | 10,292 | 10,011 | 11,460 | 11,239 | 11,672 | 11,454 | 12,380 | 12,219 | 11,508 | 12,017 | 11,053 | 11,498 |
| 2011 | 11,116 | 10,576 | 12,320 | 12,143 | 12,528 | 12,510 | 12,344 | 12,550 | 11,784 | 11,870 | 11,279 | 11,592 |
| 2012 | 10,668 | 10,772 | 11,590 | 11,946 | 12,511 | 12,932 | 13,170 | 13,476 | 12,254 | 12,795 | 12,242 | 12,026 |
| 2013 | 11,938 | 11,241 | 12,846 | 12,515 | 13,248 | 13,097 | 13,756 | 13,942 | 12,562 | 13,621 | 12,791 | 13,002 |
| 2014 | 12,123 | 11,303 | 12,836 | 12,640 | 13,133 | 12,917 | 13,830 | 14,016 | 12,750 | 13,380 | 12,472 | 13,013 |
| 2015 | 12,610 | 11,728 | 13,215 | 13,106 | 13,625 | 13,664 | 14,210 | 13,889 | 13,307 | 13,602 | 12,811 | 13,316 |
| 2016 | 12,836 | 12,660 | 13,628 | 13,495 | 14,060 | 14,041 | 14,551 | 14,804 | 13,634 | 13,794 | 13,074 | 13,442 |
| 2017 | 12,595 | 12,017 | 13,959 | 13,567 | 14,463 | 14,428 | 14,808 | 15,052 | 13,971 | 14,395 | 13,358 | 13,799 |
| 2018 | 13,090 | 12,321 | 14,017 | 13,718 | 14,600 | 14,350 | 14,908 | 15,142 | 13,759 | 14,347 | 13,547 | 13,645 |
| 2019 | 13,269 | 11,620 | 13,862 | 13,713 | 14,406 | 14,216 | 14,854 | 15,176 | 13,857 | 14,375 | 13,580 | 13,902 |
| 2020 | 13,411 | 13,086 | 12,062 | 8,397 | 10,923 | 12,309 | 13,561 | 13,703 | 12,742 | 13,457 | 12,098 | 12,388 |
| 2021 | 12,059 | 11,148 | 13,567 | 13,719 | 14,358 | 14,355 | 15,015 | 14,317 | 13,650 | 14,104 | 13,519 | 13,505 |
| 2022 | 12,664 | 12,622 | 13,994 | 13,826 | 14,144 | 13,860 | 14,496 | 14,666 | 13,551 | 14,031 | 13,402 | 13,237 |
| 2023 | 13,070 | 12,295 | 13,862 | 13,565 | 14,518 | 14,116 | 14,657 | 14,781 | 13,698 | 14,426 | 13,531 | 13,556 |
| 2024 | 12,834 | |||||||||||
| - = No Data Reported; -- = Not Applicable; NA = Not Available; W = Withheld to avoid disclosure of individual company data. |
| Release Date: 3/29/2024 |
| Next Release Date: 4/30/2024 |