|
Download Data (XLS File) |
|
||||||||
|
||||||||
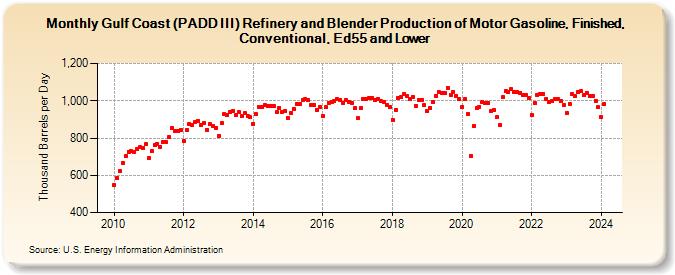
| Gulf Coast (PADD III) Refinery and Blender Production of Motor Gasoline, Finished, Conventional, Ed55 and Lower (Thousand Barrels per Day) | ||||||||
| Year | Jan | Feb | Mar | Apr | May | Jun | Jul | Aug | Sep | Oct | Nov | Dec |
|---|---|---|---|---|---|---|---|---|---|---|---|---|
| 2010 | 548 | 588 | 625 | 668 | 701 | 727 | 729 | 726 | 740 | 750 | 749 | 766 |
| 2011 | 695 | 730 | 761 | 769 | 752 | 777 | 776 | 804 | 855 | 837 | 836 | 842 |
| 2012 | 784 | 843 | 877 | 872 | 884 | 894 | 868 | 883 | 845 | 875 | 866 | 856 |
| 2013 | 813 | 878 | 928 | 924 | 940 | 945 | 922 | 938 | 917 | 932 | 919 | 911 |
| 2014 | 877 | 927 | 968 | 969 | 978 | 970 | 971 | 972 | 938 | 962 | 941 | 946 |
| 2015 | 909 | 936 | 958 | 980 | 981 | 1,005 | 1,009 | 1,003 | 978 | 979 | 952 | 967 |
| 2016 | 916 | 964 | 990 | 991 | 997 | 1,008 | 1,006 | 990 | 1,004 | 994 | 987 | 962 |
| 2017 | 906 | 961 | 1,009 | 1,009 | 1,013 | 1,017 | 1,006 | 1,010 | 997 | 992 | 978 | 964 |
| 2018 | 899 | 953 | 1,017 | 1,019 | 1,037 | 1,028 | 1,009 | 1,022 | 974 | 1,005 | 1,005 | 975 |
| 2019 | 944 | 961 | 994 | 1,026 | 1,045 | 1,042 | 1,041 | 1,069 | 1,033 | 1,046 | 1,026 | 1,009 |
| 2020 | 967 | 1,009 | 929 | 703 | 865 | 962 | 969 | 991 | 986 | 989 | 946 | 950 |
| 2021 | 911 | 871 | 1,018 | 1,051 | 1,047 | 1,062 | 1,049 | 1,045 | 1,043 | 1,033 | 1,031 | 1,014 |
| 2022 | 924 | 986 | 1,030 | 1,037 | 1,038 | 1,007 | 993 | 998 | 1,007 | 1,007 | 997 | 977 |
| 2023 | 934 | 983 | 1,035 | 1,024 | 1,048 | 1,050 | 1,029 | 1,044 | 1,023 | 1,026 | 999 | 965 |
| 2024 | 911 | |||||||||||
| - = No Data Reported; -- = Not Applicable; NA = Not Available; W = Withheld to avoid disclosure of individual company data. |
| Release Date: 3/29/2024 |
| Next Release Date: 4/30/2024 |