|
Download Data (XLS File) |
|
||||||||
|
||||||||
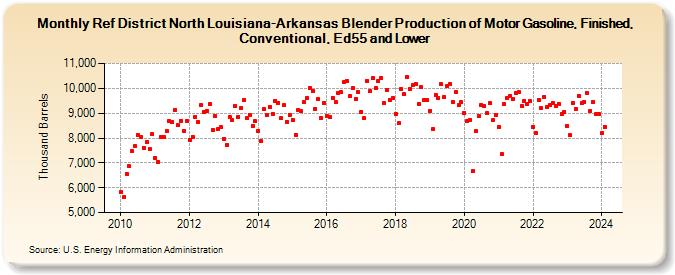
| Ref District North Louisiana-Arkansas Blender Production of Motor Gasoline, Finished, Conventional, Ed55 and Lower (Thousand Barrels) | ||||||||
| Year | Jan | Feb | Mar | Apr | May | Jun | Jul | Aug | Sep | Oct | Nov | Dec |
|---|---|---|---|---|---|---|---|---|---|---|---|---|
| 2010 | 5,817 | 5,630 | 6,545 | 6,860 | 7,467 | 7,672 | 8,125 | 8,061 | 7,610 | 7,839 | 7,554 | 8,146 |
| 2011 | 7,200 | 7,051 | 8,041 | 8,050 | 8,292 | 8,678 | 8,639 | 9,144 | 8,509 | 8,702 | 8,298 | 8,677 |
| 2012 | 7,925 | 8,055 | 8,853 | 8,648 | 9,319 | 9,060 | 9,105 | 9,370 | 8,320 | 8,871 | 8,353 | 8,427 |
| 2013 | 7,977 | 7,723 | 8,827 | 8,726 | 9,279 | 8,852 | 9,191 | 9,541 | 8,803 | 8,946 | 8,502 | 8,669 |
| 2014 | 8,298 | 7,861 | 9,187 | 8,928 | 9,252 | 8,978 | 9,506 | 9,420 | 8,802 | 9,314 | 8,658 | 8,930 |
| 2015 | 8,741 | 8,132 | 9,128 | 9,076 | 9,448 | 9,617 | 10,019 | 9,898 | 9,187 | 9,564 | 8,811 | 9,401 |
| 2016 | 8,892 | 8,837 | 9,612 | 9,436 | 9,807 | 9,834 | 10,250 | 10,304 | 9,678 | 10,019 | 9,583 | 9,845 |
| 2017 | 9,053 | 8,803 | 10,303 | 9,875 | 10,397 | 10,023 | 10,288 | 10,418 | 9,398 | 9,949 | 9,549 | 9,613 |
| 2018 | 8,977 | 8,586 | 9,988 | 9,760 | 10,450 | 9,992 | 10,123 | 10,183 | 9,363 | 10,038 | 9,546 | 9,519 |
| 2019 | 9,098 | 8,354 | 9,733 | 9,613 | 10,156 | 9,660 | 10,095 | 10,190 | 9,436 | 9,855 | 9,320 | 9,434 |
| 2020 | 8,997 | 8,688 | 8,740 | 6,681 | 8,268 | 8,886 | 9,340 | 9,284 | 9,004 | 9,393 | 8,707 | 8,926 |
| 2021 | 8,459 | 7,356 | 9,368 | 9,628 | 9,702 | 9,581 | 9,814 | 9,841 | 9,294 | 9,502 | 9,384 | 9,485 |
| 2022 | 8,461 | 8,193 | 9,529 | 9,196 | 9,670 | 9,250 | 9,314 | 9,429 | 9,279 | 9,370 | 8,978 | 9,052 |
| 2023 | 8,503 | 8,105 | 9,420 | 9,180 | 9,696 | 9,392 | 9,458 | 9,808 | 9,080 | 9,457 | 8,952 | 8,949 |
| 2024 | 8,197 | |||||||||||
| - = No Data Reported; -- = Not Applicable; NA = Not Available; W = Withheld to avoid disclosure of individual company data. |
| Release Date: 3/29/2024 |
| Next Release Date: 4/30/2024 |