|
Download Data (XLS File) |
|
||||||||
|
||||||||
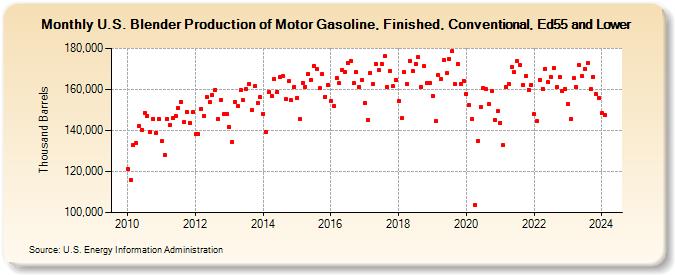
| U.S. Blender Production of Motor Gasoline, Finished, Conventional, Ed55 and Lower (Thousand Barrels) | ||||||||
| Year | Jan | Feb | Mar | Apr | May | Jun | Jul | Aug | Sep | Oct | Nov | Dec |
|---|---|---|---|---|---|---|---|---|---|---|---|---|
| 2010 | 121,080 | 115,940 | 133,084 | 133,823 | 141,993 | 140,370 | 148,712 | 147,241 | 139,191 | 145,785 | 138,972 | 145,667 |
| 2011 | 134,678 | 128,238 | 145,623 | 142,818 | 145,974 | 146,946 | 150,988 | 153,808 | 144,242 | 148,902 | 143,665 | 148,859 |
| 2012 | 138,190 | 138,272 | 150,668 | 147,251 | 156,290 | 153,672 | 157,257 | 159,883 | 145,663 | 155,021 | 147,885 | 148,222 |
| 2013 | 141,626 | 134,402 | 154,093 | 151,820 | 159,481 | 154,690 | 160,237 | 162,647 | 150,078 | 161,669 | 153,543 | 156,438 |
| 2014 | 148,236 | 139,442 | 158,598 | 156,905 | 165,041 | 158,875 | 165,916 | 166,348 | 155,214 | 163,973 | 154,644 | 161,287 |
| 2015 | 156,066 | 145,454 | 163,358 | 161,392 | 167,541 | 164,812 | 171,574 | 169,973 | 160,483 | 167,630 | 156,516 | 162,265 |
| 2016 | 154,556 | 151,847 | 165,774 | 162,976 | 169,561 | 168,596 | 172,931 | 174,077 | 163,131 | 168,487 | 161,236 | 164,818 |
| 2017 | 153,362 | 145,035 | 168,166 | 162,756 | 172,374 | 169,426 | 172,621 | 176,087 | 161,263 | 168,932 | 161,491 | 164,726 |
| 2018 | 154,221 | 145,928 | 168,407 | 162,528 | 174,044 | 168,933 | 172,528 | 175,697 | 161,232 | 171,366 | 163,331 | 163,117 |
| 2019 | 156,878 | 144,700 | 166,885 | 164,870 | 174,384 | 167,859 | 175,022 | 178,570 | 162,580 | 172,473 | 162,837 | 164,240 |
| 2020 | 157,784 | 152,346 | 145,488 | 103,733 | 134,929 | 151,332 | 160,787 | 160,050 | 152,792 | 159,256 | 145,250 | 149,247 |
| 2021 | 143,843 | 132,717 | 161,303 | 162,762 | 170,786 | 168,321 | 173,781 | 171,916 | 162,249 | 166,547 | 159,956 | 162,394 |
| 2022 | 147,862 | 144,559 | 164,732 | 160,390 | 170,049 | 163,425 | 165,931 | 170,440 | 161,346 | 166,119 | 159,085 | 160,124 |
| 2023 | 152,671 | 145,680 | 165,416 | 161,017 | 171,758 | 166,382 | 169,719 | 172,933 | 160,098 | 166,249 | 157,626 | 155,750 |
| 2024 | 148,340 | |||||||||||
| - = No Data Reported; -- = Not Applicable; NA = Not Available; W = Withheld to avoid disclosure of individual company data. |
| Release Date: 3/29/2024 |
| Next Release Date: 4/30/2024 |