|
Download Data (XLS File) |
|
||||||||
|
||||||||
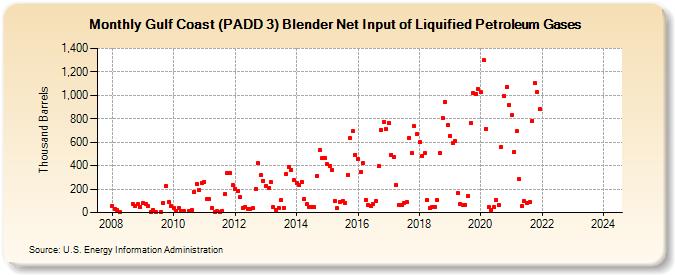
| Gulf Coast (PADD 3) Blender Net Input of Liquified Petroleum Gases (Thousand Barrels) | ||||||||
| Year | Jan | Feb | Mar | Apr | May | Jun | Jul | Aug | Sep | Oct | Nov | Dec |
|---|---|---|---|---|---|---|---|---|---|---|---|---|
| 2008 | 60 | 34 | 21 | 3 | 74 | 56 | 69 | 47 | ||||
| 2009 | 80 | 75 | 52 | 4 | 26 | 1 | 7 | 80 | 227 | 88 | 59 | |
| 2010 | 41 | 16 | 37 | 11 | 12 | 15 | 18 | 177 | 242 | 195 | 251 | |
| 2011 | 262 | 113 | 115 | 43 | 7 | 10 | 7 | 17 | 157 | 339 | 339 | 234 |
| 2012 | 205 | 180 | 131 | 42 | 49 | 32 | 28 | 35 | 202 | 421 | 318 | 272 |
| 2013 | 227 | 212 | 257 | 44 | 23 | 40 | 106 | 43 | 329 | 390 | 366 | 275 |
| 2014 | 250 | 231 | 261 | 115 | 71 | 48 | 46 | 47 | 314 | 532 | 469 | 467 |
| 2015 | 410 | 399 | 366 | 99 | 35 | 94 | 98 | 85 | 323 | 632 | 692 | 494 |
| 2016 | 458 | 348 | 421 | 110 | 63 | 56 | 70 | 97 | 393 | 705 | 773 | 710 |
| 2017 | 765 | 495 | 471 | 236 | 63 | 64 | 85 | 86 | 639 | 506 | 736 | 669 |
| 2018 | 598 | 485 | 505 | 111 | 35 | 45 | 50 | 108 | 510 | 808 | 943 | 749 |
| 2019 | 657 | 590 | 608 | 163 | 75 | 66 | 68 | 137 | 762 | 1,019 | 1,015 | 1,053 |
| 2020 | 1,025 | 1,298 | 716 | 49 | 22 | 47 | 106 | 63 | 561 | 990 | 1,072 | 921 |
| 2021 | 829 | 520 | 692 | 283 | 58 | 95 | 85 | 86 | 784 | 1,104 | 1,026 | 880 |
| 2022 | -- | -- | -- | -- | -- | -- | -- | -- | -- | -- | -- | -- |
| 2023 | -- | -- | -- | -- | -- | -- | -- | -- | -- | -- | -- | -- |
| 2024 | -- | |||||||||||
| - = No Data Reported; -- = Not Applicable; NA = Not Available; W = Withheld to avoid disclosure of individual company data. |
| Release Date: 3/29/2024 |
| Next Release Date: 4/30/2024 |
Referring Pages: