|
Download Data (XLS File) |
|
||||||||
|
||||||||
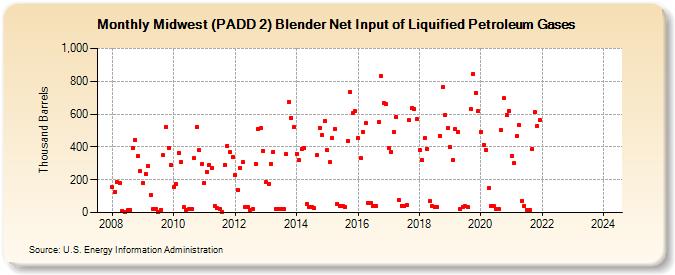
| Midwest (PADD 2) Blender Net Input of Liquified Petroleum Gases (Thousand Barrels) | ||||||||
| Year | Jan | Feb | Mar | Apr | May | Jun | Jul | Aug | Sep | Oct | Nov | Dec |
|---|---|---|---|---|---|---|---|---|---|---|---|---|
| 2008 | 154 | 128 | 184 | 180 | 11 | 4 | 13 | 15 | 392 | 442 | 344 | 253 |
| 2009 | 180 | 234 | 285 | 110 | 21 | 23 | 1 | 18 | 348 | 524 | 396 | 291 |
| 2010 | 153 | 173 | 365 | 309 | 31 | 16 | 20 | 23 | 330 | 521 | 381 | 297 |
| 2011 | 181 | 246 | 291 | 272 | 42 | 26 | 22 | 6 | 291 | 408 | 367 | 336 |
| 2012 | 228 | 138 | 273 | 306 | 31 | 31 | 16 | 22 | 296 | 512 | 513 | 377 |
| 2013 | 186 | 177 | 296 | 371 | 24 | 19 | 21 | 19 | 357 | 675 | 575 | 521 |
| 2014 | 359 | 318 | 390 | 392 | 52 | 33 | 35 | 26 | 350 | 517 | 472 | 556 |
| 2015 | 381 | 306 | 457 | 512 | 55 | 38 | 38 | 33 | 438 | 733 | 607 | 617 |
| 2016 | 455 | 330 | 493 | 544 | 61 | 58 | 39 | 41 | 551 | 830 | 665 | 659 |
| 2017 | 393 | 369 | 493 | 583 | 79 | 43 | 38 | 47 | 563 | 634 | 628 | 568 |
| 2018 | 381 | 320 | 454 | 389 | 70 | 43 | 33 | 35 | 469 | 764 | 597 | 514 |
| 2019 | 399 | 318 | 508 | 493 | 22 | 35 | 38 | 32 | 628 | 845 | 731 | 618 |
| 2020 | 490 | 413 | 383 | 150 | 40 | 38 | 21 | 21 | 500 | 696 | 596 | 621 |
| 2021 | 347 | 299 | 464 | 531 | 73 | 41 | 17 | 15 | 388 | 612 | 529 | 563 |
| 2022 | -- | -- | -- | -- | -- | -- | -- | -- | -- | -- | -- | -- |
| 2023 | -- | -- | -- | -- | -- | -- | -- | -- | -- | -- | -- | -- |
| 2024 | -- | |||||||||||
| - = No Data Reported; -- = Not Applicable; NA = Not Available; W = Withheld to avoid disclosure of individual company data. |
| Release Date: 3/29/2024 |
| Next Release Date: 4/30/2024 |
Referring Pages: