|
Download Data (XLS File) |
|
||||||||
|
||||||||
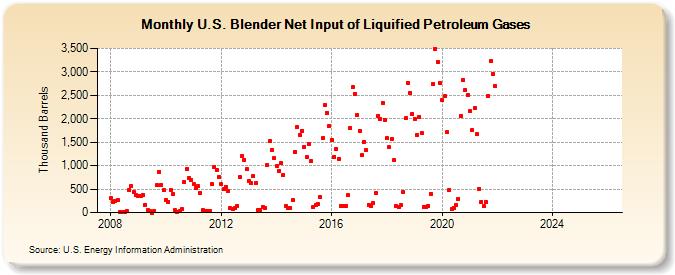
| U.S. Blender Net Input of Liquified Petroleum Gases (Thousand Barrels) | ||||||||
| Year | Jan | Feb | Mar | Apr | May | Jun | Jul | Aug | Sep | Oct | Nov | Dec |
|---|---|---|---|---|---|---|---|---|---|---|---|---|
| 2008 | 306 | 229 | 253 | 268 | 12 | 7 | 14 | 26 | 488 | 559 | 436 | 373 |
| 2009 | 353 | 363 | 377 | 168 | 48 | 27 | 1 | 25 | 581 | 871 | 589 | 475 |
| 2010 | 272 | 231 | 482 | 397 | 48 | 16 | 36 | 69 | 642 | 922 | 741 | 693 |
| 2011 | 599 | 530 | 556 | 418 | 51 | 37 | 30 | 25 | 602 | 970 | 911 | 755 |
| 2012 | 599 | 497 | 555 | 455 | 88 | 67 | 88 | 141 | 762 | 1,201 | 1,127 | 919 |
| 2013 | 676 | 622 | 777 | 630 | 51 | 63 | 129 | 96 | 1,004 | 1,519 | 1,342 | 1,154 |
| 2014 | 986 | 895 | 1,049 | 792 | 137 | 107 | 101 | 267 | 1,299 | 1,819 | 1,654 | 1,748 |
| 2015 | 1,404 | 1,176 | 1,455 | 1,096 | 114 | 156 | 186 | 322 | 1,583 | 2,289 | 2,130 | 1,850 |
| 2016 | 1,557 | 1,191 | 1,361 | 1,148 | 146 | 139 | 145 | 369 | 1,805 | 2,671 | 2,537 | 2,077 |
| 2017 | 1,739 | 1,218 | 1,512 | 1,333 | 162 | 145 | 209 | 414 | 2,067 | 1,984 | 2,346 | 1,980 |
| 2018 | 1,579 | 1,388 | 1,569 | 1,113 | 130 | 112 | 154 | 437 | 2,006 | 2,765 | 2,558 | 2,098 |
| 2019 | 2,004 | 1,664 | 2,045 | 1,687 | 121 | 125 | 140 | 403 | 2,744 | 3,497 | 3,210 | 2,766 |
| 2020 | 2,391 | 2,477 | 1,712 | 489 | 71 | 104 | 161 | 299 | 2,055 | 2,835 | 2,612 | 2,509 |
| 2021 | 2,157 | 1,760 | 2,226 | 1,667 | 508 | 230 | 132 | 226 | 2,477 | 3,228 | 2,959 | 2,696 |
| 2022 | -- | -- | -- | -- | -- | -- | -- | -- | -- | -- | -- | -- |
| 2023 | -- | -- | -- | -- | -- | -- | -- | -- | -- | -- | -- | -- |
| 2024 | -- | |||||||||||
| - = No Data Reported; -- = Not Applicable; NA = Not Available; W = Withheld to avoid disclosure of individual company data. |
| Release Date: 3/29/2024 |
| Next Release Date: 4/30/2024 |
Referring Pages: