|
Download Data (XLS File) |
|
||||||||
|
||||||||
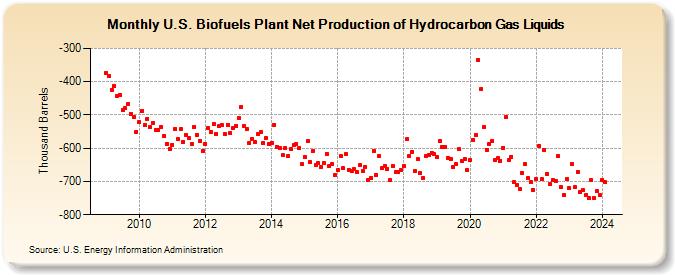
| U.S. Biofuels Plant Net Production of Hydrocarbon Gas Liquids (Thousand Barrels) | ||||||||
| Year | Jan | Feb | Mar | Apr | May | Jun | Jul | Aug | Sep | Oct | Nov | Dec |
|---|---|---|---|---|---|---|---|---|---|---|---|---|
| 2009 | -373 | -383 | -425 | -413 | -443 | -440 | -484 | -480 | -467 | -496 | -506 | -550 |
| 2010 | -522 | -487 | -531 | -512 | -537 | -523 | -544 | -545 | -536 | -564 | -586 | -601 |
| 2011 | -589 | -542 | -573 | -543 | -580 | -559 | -569 | -587 | -535 | -559 | -577 | -609 |
| 2012 | -587 | -540 | -551 | -527 | -556 | -534 | -530 | -557 | -529 | -553 | -538 | -532 |
| 2013 | -508 | -476 | -532 | -543 | -585 | -571 | -582 | -557 | -552 | -585 | -569 | -587 |
| 2014 | -583 | -529 | -595 | -598 | -621 | -599 | -624 | -602 | -590 | -588 | -600 | -649 |
| 2015 | -627 | -579 | -641 | -609 | -650 | -646 | -657 | -644 | -616 | -653 | -647 | -681 |
| 2016 | -666 | -623 | -661 | -618 | -665 | -668 | -664 | -673 | -652 | -668 | -656 | -696 |
| 2017 | -689 | -609 | -680 | -624 | -661 | -654 | -662 | -697 | -654 | -672 | -673 | -667 |
| 2018 | -653 | -572 | -624 | -610 | -669 | -634 | -676 | -689 | -623 | -621 | -613 | -617 |
| 2019 | -627 | -579 | -595 | -595 | -629 | -634 | -658 | -648 | -603 | -640 | -633 | -665 |
| 2020 | -636 | -575 | -561 | -334 | -423 | -536 | -604 | -586 | -578 | -635 | -631 | -638 |
| 2021 | -598 | -506 | -637 | -625 | -703 | -711 | -723 | -674 | -649 | -690 | -702 | -725 |
| 2022 | -693 | -592 | -694 | -604 | -677 | -709 | -696 | -698 | -624 | -717 | -740 | -692 |
| 2023 | -721 | -649 | -717 | -671 | -733 | -727 | -741 | -751 | -697 | -750 | -730 | -741 |
| 2024 | -696 | |||||||||||
| - = No Data Reported; -- = Not Applicable; NA = Not Available; W = Withheld to avoid disclosure of individual company data. |
| Release Date: 3/29/2024 |
| Next Release Date: 4/30/2024 |