|
Download Data (XLS File) |
|
||||||||
|
||||||||
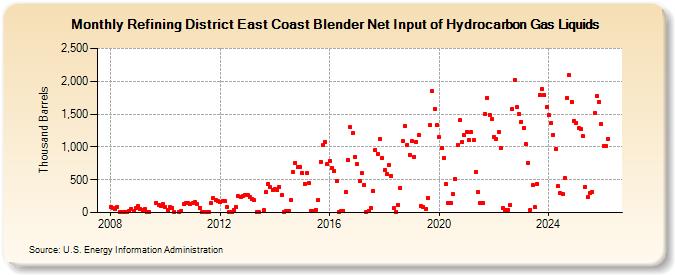
| Refining District East Coast Blender Net Input of Hydrocarbon Gas Liquids (Thousand Barrels) | ||||||||
| Year | Jan | Feb | Mar | Apr | May | Jun | Jul | Aug | Sep | Oct | Nov | Dec |
|---|---|---|---|---|---|---|---|---|---|---|---|---|
| 2008 | 92 | 67 | 48 | 85 | 1 | 3 | 1 | 11 | 22 | 61 | 23 | 73 |
| 2009 | 93 | 54 | 40 | 54 | 1 | 3 | 153 | 120 | 105 | 125 | ||
| 2010 | 78 | 42 | 80 | 77 | 5 | 1 | 28 | 123 | 152 | 151 | 135 | |
| 2011 | 143 | 157 | 133 | 75 | 2 | 1 | 1 | 2 | 144 | 220 | 188 | 178 |
| 2012 | 158 | 179 | 171 | 90 | 6 | 3 | 43 | 84 | 250 | 241 | 250 | 269 |
| 2013 | 260 | 231 | 209 | 184 | 3 | 2 | 32 | 308 | 442 | 386 | 342 | |
| 2014 | 358 | 339 | 389 | 271 | 12 | 24 | 19 | 192 | 613 | 761 | 697 | 700 |
| 2015 | 595 | 442 | 596 | 448 | 20 | 21 | 45 | 198 | 777 | 1,022 | 1,081 | 736 |
| 2016 | 791 | 675 | 631 | 480 | 15 | 21 | 30 | 315 | 802 | 1,296 | 1,207 | 851 |
| 2017 | 734 | 478 | 597 | 427 | 10 | 30 | 75 | 328 | 959 | 892 | 1,121 | 833 |
| 2018 | 646 | 581 | 718 | 559 | 73 | 13 | 122 | 381 | 1,084 | 1,314 | 1,032 | 882 |
| 2019 | 1,087 | 853 | 1,082 | 1,174 | 106 | 84 | 54 | 222 | 1,328 | 1,846 | 1,581 | 1,333 |
| 2020 | 1,146 | 988 | 829 | 435 | 138 | 151 | 277 | 509 | 1,028 | 1,404 | 1,081 | 1,176 |
| 2021 | 1,229 | 1,104 | 1,220 | 1,099 | 611 | 318 | 140 | 150 | 1,503 | 1,749 | 1,492 | 1,418 |
| 2022 | 1,158 | 1,120 | 1,233 | 983 | 76 | 32 | 44 | 116 | 1,570 | 2,025 | 1,602 | 1,502 |
| 2023 | 1,380 | 1,294 | 1,029 | 762 | 41 | 419 | 80 | 433 | 1,768 | 1,840 | 1,760 | 1,606 |
| 2024 | 1,481 | |||||||||||
| - = No Data Reported; -- = Not Applicable; NA = Not Available; W = Withheld to avoid disclosure of individual company data. |
| Release Date: 3/29/2024 |
| Next Release Date: 4/30/2024 |
Referring Pages: