|
Download Data (XLS File) |
|
||||||||
|
||||||||
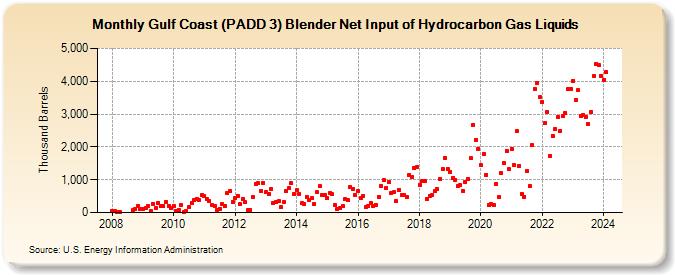
| Gulf Coast (PADD 3) Blender Net Input of Hydrocarbon Gas Liquids (Thousand Barrels) | ||||||||
| Year | Jan | Feb | Mar | Apr | May | Jun | Jul | Aug | Sep | Oct | Nov | Dec |
|---|---|---|---|---|---|---|---|---|---|---|---|---|
| 2008 | 60 | 34 | 21 | 3 | 74 | 106 | 197 | 100 | ||||
| 2009 | 108 | 144 | 201 | 45 | 272 | 135 | 302 | 186 | 192 | 333 | 204 | 124 |
| 2010 | 201 | 37 | 92 | 222 | 12 | 34 | 155 | 296 | 385 | 428 | 373 | 526 |
| 2011 | 504 | 403 | 364 | 228 | 193 | 92 | 118 | 255 | 196 | 590 | 653 | 336 |
| 2012 | 429 | 510 | 256 | 409 | 312 | 66 | 85 | 481 | 875 | 892 | 659 | 904 |
| 2013 | 618 | 574 | 719 | 299 | 313 | 341 | 155 | 319 | 642 | 745 | 887 | 580 |
| 2014 | 674 | 559 | 287 | 263 | 488 | 377 | 439 | 263 | 614 | 799 | 543 | 528 |
| 2015 | 430 | 591 | 557 | 219 | 110 | 140 | 192 | 406 | 368 | 784 | 718 | 533 |
| 2016 | 655 | 430 | 516 | 173 | 195 | 282 | 202 | 232 | 484 | 814 | 979 | 756 |
| 2017 | 942 | 603 | 616 | 351 | 697 | 540 | 527 | 475 | 1,152 | 1,089 | 1,365 | 1,392 |
| 2018 | 849 | 952 | 953 | 423 | 513 | 533 | 644 | 707 | 1,025 | 1,327 | 1,656 | 1,337 |
| 2019 | 1,236 | 1,055 | 994 | 821 | 829 | 664 | 935 | 1,019 | 1,656 | 2,676 | 2,210 | 1,951 |
| 2020 | 1,434 | 1,797 | 1,155 | 227 | 260 | 232 | 882 | 473 | 1,203 | 1,504 | 1,873 | 1,313 |
| 2021 | 1,947 | 1,438 | 2,480 | 1,425 | 574 | 483 | 1,272 | 813 | 2,045 | 3,765 | 3,948 | 3,510 |
| 2022 | 3,374 | 2,724 | 3,061 | 1,735 | 2,343 | 2,533 | 2,921 | 2,487 | 2,940 | 3,036 | 3,752 | 3,775 |
| 2023 | 4,017 | 3,432 | 3,724 | 2,942 | 2,968 | 2,918 | 2,695 | 3,077 | 4,161 | 4,535 | 4,500 | 4,173 |
| 2024 | 4,049 | |||||||||||
| - = No Data Reported; -- = Not Applicable; NA = Not Available; W = Withheld to avoid disclosure of individual company data. |
| Release Date: 3/29/2024 |
| Next Release Date: 4/30/2024 |
Referring Pages: