|
Download Data (XLS File) |
|
||||||||
|
||||||||
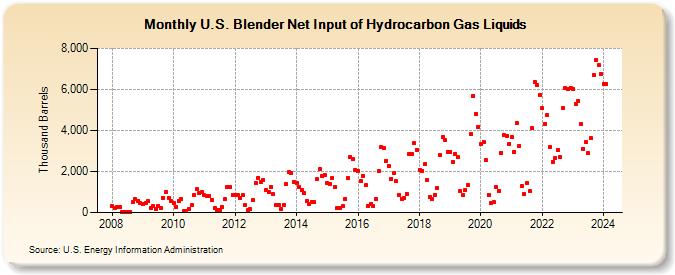
| U.S. Blender Net Input of Hydrocarbon Gas Liquids (Thousand Barrels) | ||||||||
| Year | Jan | Feb | Mar | Apr | May | Jun | Jul | Aug | Sep | Oct | Nov | Dec |
|---|---|---|---|---|---|---|---|---|---|---|---|---|
| 2008 | 322 | 244 | 271 | 281 | 32 | 32 | 37 | 45 | 512 | 639 | 585 | 445 |
| 2009 | 393 | 449 | 547 | 223 | 321 | 188 | 320 | 227 | 727 | 1,013 | 723 | 555 |
| 2010 | 455 | 278 | 567 | 640 | 72 | 65 | 182 | 353 | 867 | 1,132 | 940 | 987 |
| 2011 | 842 | 820 | 805 | 603 | 237 | 119 | 142 | 263 | 642 | 1,227 | 1,234 | 876 |
| 2012 | 837 | 836 | 705 | 833 | 360 | 102 | 164 | 591 | 1,440 | 1,698 | 1,503 | 1,594 |
| 2013 | 1,085 | 995 | 1,251 | 891 | 352 | 376 | 196 | 383 | 1,397 | 1,953 | 1,935 | 1,490 |
| 2014 | 1,421 | 1,238 | 1,085 | 962 | 562 | 440 | 505 | 497 | 1,616 | 2,118 | 1,761 | 1,833 |
| 2015 | 1,449 | 1,412 | 1,695 | 1,264 | 212 | 225 | 305 | 675 | 1,694 | 2,709 | 2,609 | 2,073 |
| 2016 | 2,046 | 1,538 | 1,784 | 1,325 | 340 | 413 | 335 | 660 | 2,023 | 3,186 | 3,124 | 2,527 |
| 2017 | 2,271 | 1,640 | 1,912 | 1,525 | 866 | 677 | 713 | 919 | 2,871 | 2,846 | 3,373 | 3,065 |
| 2018 | 2,078 | 2,038 | 2,347 | 1,566 | 760 | 655 | 879 | 1,212 | 2,781 | 3,674 | 3,537 | 2,963 |
| 2019 | 2,967 | 2,458 | 2,864 | 2,703 | 1,030 | 850 | 1,092 | 1,335 | 3,827 | 5,681 | 4,818 | 4,192 |
| 2020 | 3,330 | 3,427 | 2,538 | 857 | 465 | 498 | 1,244 | 1,054 | 2,918 | 3,763 | 3,723 | 3,344 |
| 2021 | 3,682 | 2,970 | 4,356 | 3,248 | 1,305 | 911 | 1,458 | 1,048 | 4,103 | 6,368 | 6,223 | 5,718 |
| 2022 | 5,072 | 4,306 | 4,755 | 3,203 | 2,488 | 2,638 | 3,048 | 2,708 | 5,084 | 6,061 | 6,027 | 6,093 |
| 2023 | 6,003 | 5,298 | 5,413 | 4,304 | 3,117 | 3,448 | 2,887 | 3,620 | 6,709 | 7,449 | 7,185 | 6,741 |
| 2024 | 6,253 | |||||||||||
| - = No Data Reported; -- = Not Applicable; NA = Not Available; W = Withheld to avoid disclosure of individual company data. |
| Release Date: 3/29/2024 |
| Next Release Date: 4/30/2024 |
Referring Pages: