|
Download Data (XLS File) |
|
||||||||
|
||||||||
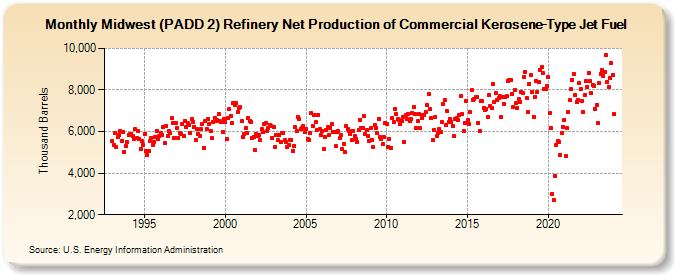
| Midwest (PADD 2) Refinery Net Production of Commercial Kerosene-Type Jet Fuel (Thousand Barrels) | ||||||||
| Year | Jan | Feb | Mar | Apr | May | Jun | Jul | Aug | Sep | Oct | Nov | Dec |
|---|---|---|---|---|---|---|---|---|---|---|---|---|
| 1993 | 5,544 | 5,350 | 5,928 | 5,253 | 5,720 | 5,832 | 6,015 | 5,546 | 5,991 | 5,036 | 5,285 | 5,492 |
| 1994 | 5,816 | 5,873 | 5,899 | 5,807 | 5,657 | 6,115 | 5,667 | 6,038 | 5,647 | 5,182 | 5,529 | 5,372 |
| 1995 | 5,887 | 5,075 | 4,868 | 5,081 | 5,569 | 5,699 | 5,368 | 5,503 | 5,732 | 6,047 | 5,636 | 5,764 |
| 1996 | 5,920 | 5,820 | 6,197 | 5,427 | 6,258 | 5,771 | 6,014 | 5,916 | 6,660 | 6,414 | 5,705 | 6,413 |
| 1997 | 6,177 | 5,712 | 5,924 | 5,865 | 6,375 | 5,808 | 6,531 | 6,206 | 6,409 | 6,328 | 5,951 | 6,587 |
| 1998 | 6,466 | 6,219 | 5,614 | 6,099 | 5,904 | 5,796 | 6,099 | 6,384 | 5,199 | 6,487 | 6,145 | 6,610 |
| 1999 | 6,374 | 6,026 | 5,677 | 6,455 | 6,667 | 6,508 | 6,547 | 6,836 | 6,500 | 6,446 | 5,986 | 6,608 |
| 2000 | 6,465 | 5,633 | 6,643 | 7,087 | 6,771 | 6,434 | 7,392 | 7,256 | 7,353 | 6,927 | 7,119 | 7,167 |
| 2001 | 6,498 | 5,726 | 5,905 | 6,166 | 5,910 | 6,645 | 6,507 | 6,474 | 5,709 | 5,762 | 5,109 | 5,874 |
| 2002 | 5,806 | 5,829 | 5,612 | 6,118 | 6,001 | 6,356 | 6,414 | 6,009 | 6,181 | 6,313 | 6,273 | 5,706 |
| 2003 | 6,237 | 5,259 | 5,816 | 5,572 | 5,817 | 5,474 | 5,926 | 5,926 | 5,571 | 5,495 | 5,268 | 5,364 |
| 2004 | 5,616 | 5,584 | 5,079 | 5,318 | 6,196 | 6,026 | 6,719 | 6,580 | 6,134 | 6,154 | 6,265 | 5,959 |
| 2005 | 6,120 | 5,650 | 5,595 | 5,907 | 6,883 | 6,248 | 6,817 | 6,441 | 6,062 | 6,815 | 6,110 | 5,830 |
| 2006 | 6,004 | 5,147 | 5,742 | 6,060 | 6,198 | 5,841 | 6,179 | 6,358 | 6,000 | 5,997 | 5,283 | 5,963 |
| 2007 | 6,020 | 5,699 | 5,813 | 5,155 | 5,394 | 5,010 | 6,273 | 6,129 | 6,012 | 5,906 | 5,570 | 6,029 |
| 2008 | 5,800 | 5,662 | 5,520 | 6,054 | 6,555 | 6,194 | 6,160 | 6,764 | 5,876 | 6,052 | 5,787 | 5,562 |
| 2009 | 6,157 | 5,612 | 5,241 | 6,313 | 6,178 | 5,943 | 6,600 | 5,755 | 5,650 | 5,384 | 5,736 | 6,412 |
| 2010 | 6,361 | 5,274 | 5,657 | 5,211 | 6,637 | 6,448 | 7,086 | 6,826 | 6,588 | 6,551 | 6,361 | 6,498 |
| 2011 | 6,694 | 5,490 | 6,774 | 6,598 | 6,833 | 6,493 | 6,614 | 6,915 | 7,188 | 6,834 | 6,152 | 6,491 |
| 2012 | 6,841 | 6,147 | 6,675 | 6,788 | 6,788 | 6,963 | 7,277 | 7,802 | 7,085 | 6,639 | 5,573 | 6,097 |
| 2013 | 6,695 | 5,779 | 5,952 | 6,118 | 5,985 | 6,477 | 7,311 | 7,524 | 6,295 | 6,969 | 6,459 | 6,602 |
| 2014 | 6,453 | 6,267 | 5,767 | 6,603 | 6,674 | 6,575 | 6,792 | 7,731 | 6,841 | 6,028 | 6,391 | 7,490 |
| 2015 | 6,555 | 6,367 | 6,924 | 7,988 | 7,515 | 7,556 | 7,641 | 7,647 | 6,423 | 6,045 | 7,450 | 7,448 |
| 2016 | 7,123 | 7,019 | 7,090 | 6,687 | 7,761 | 7,212 | 7,115 | 8,277 | 7,409 | 7,855 | 7,500 | 7,603 |
| 2017 | 7,691 | 6,707 | 7,642 | 7,322 | 7,660 | 7,718 | 8,411 | 8,490 | 8,463 | 7,820 | 7,196 | 7,988 |
| 2018 | 7,365 | 7,145 | 7,552 | 7,427 | 7,896 | 7,873 | 8,624 | 8,885 | 7,635 | 6,930 | 8,306 | 8,725 |
| 2019 | 7,925 | 6,702 | 7,675 | 8,444 | 7,894 | 8,373 | 8,971 | 9,099 | 8,798 | 8,023 | 8,057 | 8,194 |
| 2020 | 8,604 | 6,874 | 6,156 | 3,014 | 2,727 | 3,848 | 5,343 | 5,532 | 5,515 | 4,883 | 5,924 | 6,223 |
| 2021 | 6,576 | 4,824 | 6,153 | 6,934 | 7,514 | 8,038 | 8,503 | 8,789 | 7,737 | 7,426 | 7,515 | 8,333 |
| 2022 | 8,023 | 7,475 | 6,958 | 7,755 | 8,418 | 8,155 | 8,834 | 8,426 | 7,833 | 8,254 | 8,190 | 7,094 |
| 2023 | 7,297 | 6,410 | 8,332 | 8,790 | 8,958 | 8,654 | 8,851 | 9,694 | 8,391 | 8,144 | 8,573 | 9,288 |
| 2024 | 8,711 | |||||||||||
| - = No Data Reported; -- = Not Applicable; NA = Not Available; W = Withheld to avoid disclosure of individual company data. |
| Release Date: 3/29/2024 |
| Next Release Date: 4/30/2024 |