|
Download Data (XLS File) |
|
||||||||
|
||||||||
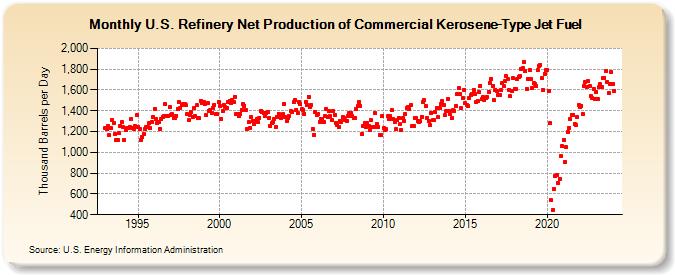
| U.S. Refinery Net Production of Commercial Kerosene-Type Jet Fuel (Thousand Barrels per Day) | ||||||||
| Year | Jan | Feb | Mar | Apr | May | Jun | Jul | Aug | Sep | Oct | Nov | Dec |
|---|---|---|---|---|---|---|---|---|---|---|---|---|
| 1993 | 1,233 | 1,221 | 1,256 | 1,163 | 1,231 | 1,310 | 1,281 | 1,172 | 1,123 | 1,115 | 1,182 | 1,256 |
| 1994 | 1,293 | 1,241 | 1,119 | 1,215 | 1,231 | 1,231 | 1,243 | 1,321 | 1,238 | 1,226 | 1,249 | 1,359 |
| 1995 | 1,244 | 1,226 | 1,123 | 1,144 | 1,176 | 1,223 | 1,246 | 1,240 | 1,282 | 1,231 | 1,294 | 1,340 |
| 1996 | 1,418 | 1,320 | 1,279 | 1,293 | 1,229 | 1,317 | 1,340 | 1,347 | 1,462 | 1,345 | 1,353 | 1,435 |
| 1997 | 1,360 | 1,369 | 1,334 | 1,335 | 1,354 | 1,418 | 1,481 | 1,431 | 1,451 | 1,461 | 1,466 | 1,453 |
| 1998 | 1,368 | 1,308 | 1,362 | 1,391 | 1,338 | 1,423 | 1,347 | 1,452 | 1,332 | 1,326 | 1,498 | 1,471 |
| 1999 | 1,482 | 1,461 | 1,356 | 1,474 | 1,396 | 1,407 | 1,382 | 1,430 | 1,457 | 1,369 | 1,366 | 1,485 |
| 2000 | 1,444 | 1,322 | 1,400 | 1,455 | 1,436 | 1,429 | 1,486 | 1,497 | 1,470 | 1,502 | 1,483 | 1,536 |
| 2001 | 1,365 | 1,370 | 1,348 | 1,373 | 1,412 | 1,467 | 1,449 | 1,411 | 1,223 | 1,289 | 1,238 | 1,344 |
| 2002 | 1,304 | 1,272 | 1,298 | 1,317 | 1,291 | 1,335 | 1,402 | 1,386 | 1,376 | 1,350 | 1,379 | 1,389 |
| 2003 | 1,331 | 1,252 | 1,282 | 1,293 | 1,324 | 1,244 | 1,340 | 1,373 | 1,339 | 1,333 | 1,366 | 1,466 |
| 2004 | 1,340 | 1,302 | 1,330 | 1,347 | 1,397 | 1,390 | 1,485 | 1,505 | 1,410 | 1,378 | 1,483 | 1,462 |
| 2005 | 1,414 | 1,407 | 1,372 | 1,489 | 1,458 | 1,536 | 1,440 | 1,456 | 1,229 | 1,170 | 1,386 | 1,362 |
| 2006 | 1,372 | 1,293 | 1,323 | 1,325 | 1,292 | 1,348 | 1,418 | 1,339 | 1,394 | 1,346 | 1,311 | 1,402 |
| 2007 | 1,362 | 1,286 | 1,264 | 1,242 | 1,304 | 1,292 | 1,339 | 1,328 | 1,308 | 1,306 | 1,349 | 1,376 |
| 2008 | 1,383 | 1,348 | 1,328 | 1,334 | 1,415 | 1,445 | 1,486 | 1,448 | 1,174 | 1,255 | 1,281 | 1,248 |
| 2009 | 1,279 | 1,253 | 1,216 | 1,308 | 1,244 | 1,244 | 1,376 | 1,275 | 1,242 | 1,166 | 1,164 | 1,351 |
| 2010 | 1,235 | 1,218 | 1,222 | 1,346 | 1,317 | 1,345 | 1,408 | 1,321 | 1,291 | 1,220 | 1,308 | 1,330 |
| 2011 | 1,268 | 1,213 | 1,326 | 1,304 | 1,367 | 1,426 | 1,432 | 1,419 | 1,451 | 1,257 | 1,249 | 1,335 |
| 2012 | 1,330 | 1,297 | 1,291 | 1,301 | 1,342 | 1,486 | 1,500 | 1,448 | 1,329 | 1,303 | 1,259 | 1,381 |
| 2013 | 1,310 | 1,308 | 1,388 | 1,427 | 1,341 | 1,425 | 1,465 | 1,494 | 1,458 | 1,357 | 1,393 | 1,511 |
| 2014 | 1,393 | 1,371 | 1,330 | 1,406 | 1,398 | 1,450 | 1,560 | 1,616 | 1,560 | 1,422 | 1,525 | 1,602 |
| 2015 | 1,470 | 1,460 | 1,447 | 1,526 | 1,549 | 1,559 | 1,603 | 1,562 | 1,486 | 1,492 | 1,581 | 1,643 |
| 2016 | 1,514 | 1,529 | 1,506 | 1,524 | 1,528 | 1,584 | 1,670 | 1,708 | 1,643 | 1,504 | 1,604 | 1,588 |
| 2017 | 1,548 | 1,551 | 1,602 | 1,668 | 1,637 | 1,682 | 1,734 | 1,705 | 1,603 | 1,538 | 1,590 | 1,713 |
| 2018 | 1,613 | 1,611 | 1,710 | 1,728 | 1,734 | 1,802 | 1,808 | 1,870 | 1,783 | 1,614 | 1,701 | 1,791 |
| 2019 | 1,702 | 1,616 | 1,664 | 1,661 | 1,637 | 1,788 | 1,834 | 1,845 | 1,712 | 1,600 | 1,757 | 1,789 |
| 2020 | 1,796 | 1,588 | 1,279 | 539 | 443 | 651 | 769 | 786 | 708 | 744 | 966 | 1,057 |
| 2021 | 1,123 | 908 | 1,048 | 1,199 | 1,237 | 1,316 | 1,363 | 1,363 | 1,272 | 1,259 | 1,338 | 1,452 |
| 2022 | 1,432 | 1,449 | 1,371 | 1,637 | 1,674 | 1,630 | 1,683 | 1,634 | 1,538 | 1,521 | 1,612 | 1,511 |
| 2023 | 1,581 | 1,511 | 1,628 | 1,655 | 1,632 | 1,719 | 1,719 | 1,782 | 1,680 | 1,572 | 1,653 | 1,771 |
| 2024 | 1,655 | 1,594 | ||||||||||
| - = No Data Reported; -- = Not Applicable; NA = Not Available; W = Withheld to avoid disclosure of individual company data. |
| Release Date: 4/30/2024 |
| Next Release Date: 5/31/2024 |