|
Download Data (XLS File) |
|
||||||||
|
||||||||
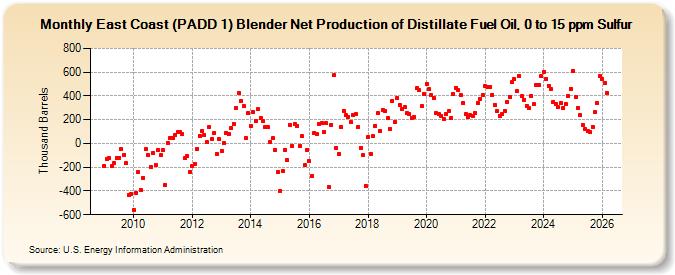
| East Coast (PADD 1) Blender Net Production of Distillate Fuel Oil, 0 to 15 ppm Sulfur (Thousand Barrels) | ||||||||
| Year | Jan | Feb | Mar | Apr | May | Jun | Jul | Aug | Sep | Oct | Nov | Dec |
|---|---|---|---|---|---|---|---|---|---|---|---|---|
| 2009 | -190 | -128 | -122 | -192 | -163 | -120 | -119 | -49 | -97 | -167 | -435 | -422 |
| 2010 | -560 | -414 | -243 | -394 | -288 | -48 | -99 | -200 | -77 | -181 | -53 | -99 |
| 2011 | -52 | -352 | 4 | 47 | 43 | 68 | 94 | 93 | 79 | -123 | -108 | -238 |
| 2012 | -187 | -170 | -43 | 64 | 108 | 74 | 8 | 140 | 36 | 90 | -88 | 34 |
| 2013 | -63 | 1 | 91 | 79 | 126 | 167 | 300 | 425 | 355 | 316 | 45 | 255 |
| 2014 | 149 | 266 | 188 | 287 | 218 | 186 | 137 | 137 | 12 | 42 | -54 | -241 |
| 2015 | -398 | -232 | -52 | -141 | 159 | -18 | 165 | 149 | -23 | 59 | -184 | -53 |
| 2016 | -152 | -276 | 88 | 80 | 161 | 171 | 96 | 170 | -368 | 158 | 575 | -39 |
| 2017 | -85 | 138 | 276 | 236 | 225 | 177 | 236 | 244 | 141 | -35 | -99 | -355 |
| 2018 | 56 | -85 | 59 | 148 | 254 | 106 | 285 | 276 | 215 | 124 | 360 | 182 |
| 2019 | 386 | 324 | 291 | 304 | 253 | 247 | 215 | 223 | 464 | 447 | 317 | 415 |
| 2020 | 502 | 455 | 405 | 384 | 253 | 246 | 233 | 203 | 248 | 270 | 214 | 412 |
| 2021 | 469 | 449 | 408 | 341 | 246 | 219 | 237 | 228 | 252 | 342 | 373 | 406 |
| 2022 | 486 | 471 | 478 | 411 | 327 | 270 | 231 | 244 | 274 | 350 | 392 | 516 |
| 2023 | 541 | 438 | 569 | 396 | 368 | 319 | 298 | 401 | 324 | 488 | 490 | 564 |
| 2024 | 593 | |||||||||||
| - = No Data Reported; -- = Not Applicable; NA = Not Available; W = Withheld to avoid disclosure of individual company data. |
| Release Date: 3/29/2024 |
| Next Release Date: 4/30/2024 |