|
Download Data (XLS File) |
|
||||||||
|
||||||||
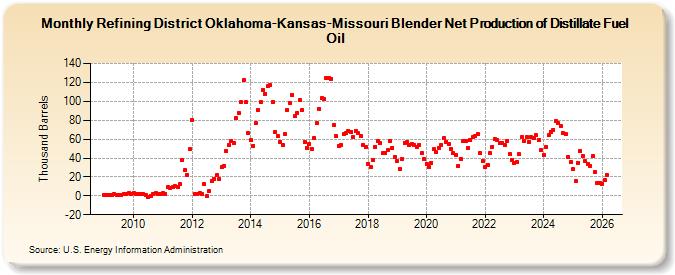
| Refining District Oklahoma-Kansas-Missouri Blender Net Production of Distillate Fuel Oil (Thousand Barrels) | ||||||||
| Year | Jan | Feb | Mar | Apr | May | Jun | Jul | Aug | Sep | Oct | Nov | Dec |
|---|---|---|---|---|---|---|---|---|---|---|---|---|
| 2009 | 1 | 1 | 1 | 1 | 2 | 1 | 1 | 1 | 2 | 2 | 3 | 2 |
| 2010 | 3 | 2 | 2 | 2 | 2 | 1 | -1 | 0 | 2 | 3 | 2 | 2 |
| 2011 | 3 | 2 | 9 | 8 | 9 | 10 | 9 | 12 | 38 | 27 | 22 | 49 |
| 2012 | 80 | 2 | 2 | 3 | 2 | 12 | 0 | 5 | 16 | 18 | 22 | 18 |
| 2013 | 30 | 32 | 47 | 54 | 58 | 56 | 82 | 88 | 99 | 122 | 99 | 66 |
| 2014 | 59 | 53 | 77 | 91 | 99 | 112 | 108 | 116 | 117 | 99 | 68 | 63 |
| 2015 | 57 | 54 | 65 | 91 | 98 | 107 | 84 | 88 | 101 | 91 | 57 | 51 |
| 2016 | 55 | 50 | 61 | 77 | 92 | 103 | 102 | 125 | 125 | 124 | 75 | 63 |
| 2017 | 53 | 54 | 65 | 66 | 69 | 68 | 62 | 69 | 66 | 63 | 54 | 52 |
| 2018 | 34 | 31 | 38 | 52 | 58 | 56 | 45 | 45 | 48 | 58 | 51 | 41 |
| 2019 | 37 | 28 | 39 | 56 | 57 | 54 | 55 | 54 | 52 | 54 | 45 | 39 |
| 2020 | 34 | 31 | 35 | 49 | 46 | 51 | 54 | 61 | 57 | 55 | 50 | 45 |
| 2021 | 43 | 32 | 39 | 58 | 58 | 51 | 59 | 62 | 63 | 65 | 45 | 37 |
| 2022 | 30 | 33 | 45 | 52 | 60 | 59 | 56 | 56 | 54 | 58 | 44 | 38 |
| 2023 | 35 | 36 | 45 | 62 | 59 | 62 | 57 | 62 | 61 | 64 | 59 | 48 |
| 2024 | 41 | |||||||||||
| - = No Data Reported; -- = Not Applicable; NA = Not Available; W = Withheld to avoid disclosure of individual company data. |
| Release Date: 3/29/2024 |
| Next Release Date: 4/30/2024 |