|
Download Data (XLS File) |
|
||||||||
|
||||||||
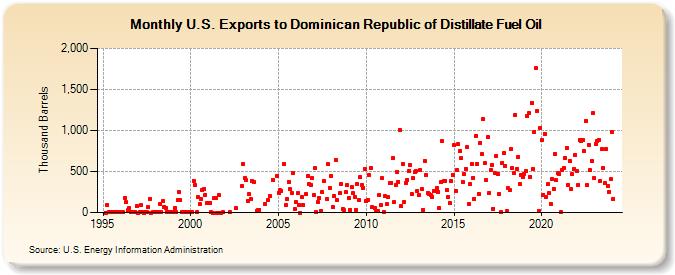
| U.S. Exports to Dominican Republic of Distillate Fuel Oil (Thousand Barrels) | ||||||||
| Year | Jan | Feb | Mar | Apr | May | Jun | Jul | Aug | Sep | Oct | Nov | Dec |
|---|---|---|---|---|---|---|---|---|---|---|---|---|
| 1995 | 0 | 93 | 1 | 1 | 1 | 1 | 1 | 1 | 1 | 1 | ||
| 1996 | 2 | 1 | 2 | 179 | 125 | 26 | 59 | 2 | 1 | 2 | 1 | 78 |
| 1997 | 0 | 1 | 89 | 1 | 0 | 2 | 2 | 66 | 171 | 0 | 1 | 1 |
| 1998 | 2 | 2 | 102 | 1 | 138 | 73 | 60 | 1 | 3 | 1 | 4 | |
| 1999 | 8 | 51 | 1 | 153 | 248 | 151 | 1 | 1 | 1 | 2 | 3 | |
| 2000 | 1 | 1 | 387 | 339 | 1 | 185 | 110 | 171 | 274 | 284 | 219 | 116 |
| 2001 | 117 | 116 | 1 | 0 | 172 | 181 | 0 | 209 | 0 | 0 | 1 | |
| 2002 | 1 | 51 | 329 | |||||||||
| 2003 | 593 | 417 | 393 | 143 | 221 | 163 | 384 | 376 | 22 | 27 | 35 | |
| 2004 | 107 | 149 | 200 | 400 | 449 | |||||||
| 2005 | 243 | 270 | 267 | 590 | 90 | 165 | 377 | 282 | 241 | 484 | 43 | |
| 2006 | 123 | 238 | 90 | 0 | 190 | 90 | 222 | 443 | 349 | 341 | 421 | |
| 2007 | 213 | 539 | 1 | 125 | 179 | 25 | 248 | 379 | 170 | 588 | 305 | |
| 2008 | 450 | 70 | 207 | 642 | 150 | 233 | 350 | 44 | 28 | 245 | 331 | |
| 2009 | 179 | 34 | 306 | 234 | 195 | 32 | 347 | 153 | 430 | 337 | 304 | 529 |
| 2010 | 135 | 149 | 454 | 547 | 63 | 60 | 23 | 25 | 214 | 90 | 415 | |
| 2011 | 11 | 198 | 100 | 189 | 358 | 366 | 662 | 125 | 339 | 500 | 373 | 1,008 |
| 2012 | 74 | 593 | 129 | 361 | 399 | 506 | 582 | 228 | 415 | 497 | 504 | 264 |
| 2013 | 215 | 518 | 290 | 32 | 632 | 455 | 243 | 230 | 213 | 192 | 258 | 264 |
| 2014 | 299 | 250 | 54 | 367 | 867 | 385 | 388 | 274 | 190 | 118 | 388 | 459 |
| 2015 | 817 | 257 | 517 | 832 | 744 | 661 | 374 | 466 | 535 | 797 | 109 | 343 |
| 2016 | 597 | 425 | 171 | 936 | 596 | 228 | 853 | 711 | 1,136 | 602 | 391 | 919 |
| 2017 | 243 | 514 | 580 | 48 | 479 | 689 | 474 | 229 | 9 | 603 | 725 | 569 |
| 2018 | 14 | 295 | 280 | 772 | 543 | 482 | 1,193 | 533 | 679 | 342 | 458 | 431 |
| 2019 | 472 | 503 | 1,176 | 1,212 | 439 | 1,340 | 530 | 987 | 1,757 | 1,234 | 23 | 1,032 |
| 2020 | 881 | 220 | 963 | 194 | 347 | 240 | 102 | 406 | 288 | 716 | 391 | 483 |
| 2021 | 475 | 2 | 524 | 540 | 670 | 791 | 341 | 630 | 287 | 465 | 528 | 705 |
| 2022 | 501 | 337 | 883 | 875 | 889 | 746 | 1,115 | 330 | 827 | 515 | 628 | 1,210 |
| 2023 | 417 | 841 | 870 | 884 | 379 | 770 | 545 | 357 | 774 | 322 | 255 | 405 |
| 2024 | 985 | |||||||||||
| - = No Data Reported; -- = Not Applicable; NA = Not Available; W = Withheld to avoid disclosure of individual company data. |
| Release Date: 3/29/2024 |
| Next Release Date: 4/30/2024 |