|
Download Data (XLS File) |
|
||||||||
|
||||||||
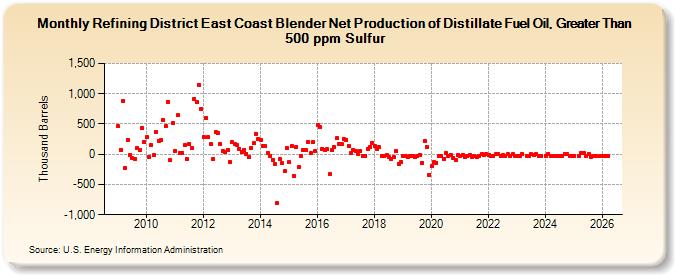
| Refining District East Coast Blender Net Production of Distillate Fuel Oil, Greater Than 500 ppm Sulfur (Thousand Barrels) | ||||||||
| Year | Jan | Feb | Mar | Apr | May | Jun | Jul | Aug | Sep | Oct | Nov | Dec |
|---|---|---|---|---|---|---|---|---|---|---|---|---|
| 2009 | 459 | 72 | 880 | -228 | 232 | -6 | -64 | -73 | 96 | 62 | 437 | 201 |
| 2010 | 287 | -42 | 150 | -16 | 360 | 218 | 235 | 566 | 459 | 870 | -101 | 517 |
| 2011 | 56 | 641 | 26 | 21 | 151 | -77 | 172 | 98 | 913 | 864 | 1,146 | 744 |
| 2012 | 292 | 600 | 280 | 171 | -86 | 361 | 345 | 163 | 53 | 35 | 70 | -123 |
| 2013 | 195 | 175 | 158 | 91 | 32 | 75 | 11 | -51 | 103 | 181 | 336 | 252 |
| 2014 | 237 | 140 | 128 | 22 | -22 | -89 | -162 | -810 | -86 | -150 | -284 | 98 |
| 2015 | -133 | 130 | -353 | 121 | -219 | -30 | 70 | 69 | 202 | 16 | 195 | 57 |
| 2016 | 486 | 449 | 91 | 76 | 80 | -335 | 65 | 113 | 261 | 176 | 164 | 257 |
| 2017 | 237 | 136 | 27 | 75 | 47 | 10 | 49 | -27 | -22 | 92 | 117 | 182 |
| 2018 | 142 | 83 | 114 | -22 | -24 | -13 | -44 | -76 | -46 | 45 | -154 | -132 |
| 2019 | -29 | -36 | -49 | -31 | -34 | -52 | -32 | -6 | -144 | 214 | 126 | -342 |
| 2020 | -202 | -135 | -142 | -31 | -23 | -82 | 15 | -22 | -6 | -62 | -92 | -9 |
| 2021 | -22 | -11 | -42 | -33 | -10 | -38 | -29 | -54 | -23 | -1 | -21 | 3 |
| 2022 | -18 | -24 | -24 | -4 | -3 | -27 | -7 | -30 | -2 | -28 | -4 | -25 |
| 2023 | -26 | -26 | 0 | -29 | -26 | -1 | -16 | -2 | -29 | -28 | ||
| 2024 | -25 | |||||||||||
| - = No Data Reported; -- = Not Applicable; NA = Not Available; W = Withheld to avoid disclosure of individual company data. |
| Release Date: 3/29/2024 |
| Next Release Date: 4/30/2024 |