|
Download Data (XLS File) |
|
||||||||
|
||||||||
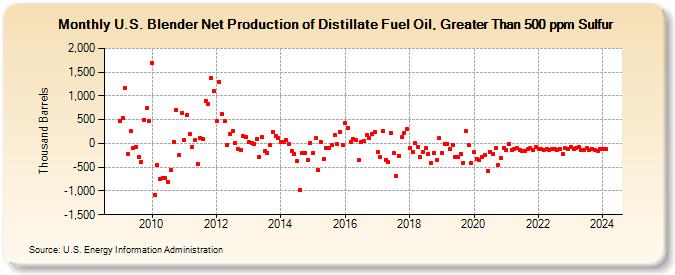
| U.S. Blender Net Production of Distillate Fuel Oil, Greater Than 500 ppm Sulfur (Thousand Barrels) | ||||||||
| Year | Jan | Feb | Mar | Apr | May | Jun | Jul | Aug | Sep | Oct | Nov | Dec |
|---|---|---|---|---|---|---|---|---|---|---|---|---|
| 2009 | 467 | 543 | 1,161 | -214 | 266 | -88 | -65 | -284 | -382 | 498 | 739 | 468 |
| 2010 | 1,702 | -1,077 | -463 | -756 | -723 | -730 | -812 | -566 | 37 | 706 | -251 | 647 |
| 2011 | 66 | 604 | 189 | -69 | 69 | -429 | 124 | 86 | 900 | 826 | 1,375 | 1,098 |
| 2012 | 466 | 1,294 | 623 | 465 | -29 | 205 | 271 | 12 | -125 | -129 | 149 | 139 |
| 2013 | 25 | 13 | -17 | 101 | -290 | 132 | -168 | -200 | -43 | 241 | 152 | 113 |
| 2014 | 36 | 25 | 81 | -10 | -158 | -220 | -380 | -985 | -202 | -201 | -349 | 9 |
| 2015 | -191 | 120 | -554 | 26 | -328 | -105 | -106 | -43 | 180 | -14 | 248 | -28 |
| 2016 | 434 | 328 | 38 | 98 | 62 | -351 | 23 | 50 | 181 | 110 | 189 | 245 |
| 2017 | -171 | -288 | 262 | -342 | -398 | 211 | -209 | -679 | -260 | 127 | 218 | 307 |
| 2018 | -100 | -171 | 5 | -66 | -289 | -177 | -101 | -218 | -415 | -193 | -353 | 113 |
| 2019 | -193 | -10 | -4 | -118 | -26 | -284 | -284 | -213 | -402 | 266 | -39 | -417 |
| 2020 | -188 | -329 | -350 | -286 | -240 | -579 | -173 | -219 | -87 | -450 | -312 | -106 |
| 2021 | -140 | -18 | -138 | -118 | -103 | -143 | -158 | -156 | -124 | -101 | -138 | -85 |
| 2022 | -117 | -127 | -131 | -122 | -137 | -126 | -110 | -131 | -110 | -232 | -106 | -116 |
| 2023 | -77 | -113 | -90 | -76 | -137 | -134 | -96 | -137 | -112 | -145 | -156 | -115 |
| 2024 | -115 | -123 | -145 | -148 | -142 | -117 | ||||||
| - = No Data Reported; -- = Not Applicable; NA = Not Available; W = Withheld to avoid disclosure of individual company data. |
| Release Date: 8/30/2024 |
| Next Release Date: 9/30/2024 |