|
Download Data (XLS File) |
|
||||||||
|
||||||||
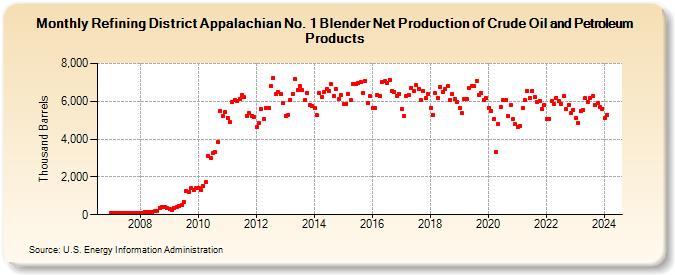
| Refining District Appalachian No. 1 Blender Net Production of Crude Oil and Petroleum Products (Thousand Barrels) | ||||||||
| Year | Jan | Feb | Mar | Apr | May | Jun | Jul | Aug | Sep | Oct | Nov | Dec |
|---|---|---|---|---|---|---|---|---|---|---|---|---|
| 2007 | 94 | 98 | 102 | 102 | 115 | 110 | 112 | 117 | 107 | 110 | 104 | 110 |
| 2008 | 106 | 112 | 138 | 138 | 162 | 170 | 193 | 193 | 352 | 425 | 418 | 342 |
| 2009 | 294 | 249 | 330 | 415 | 473 | 519 | 689 | 1,248 | 1,189 | 1,401 | 1,282 | 1,399 |
| 2010 | 1,405 | 1,331 | 1,535 | 1,714 | 3,095 | 3,009 | 3,253 | 3,297 | 3,859 | 5,511 | 5,244 | 5,407 |
| 2011 | 5,136 | 4,883 | 5,980 | 6,083 | 5,993 | 6,141 | 6,310 | 6,204 | 5,218 | 5,372 | 5,241 | 5,146 |
| 2012 | 4,621 | 4,844 | 5,588 | 5,054 | 5,655 | 5,655 | 6,815 | 7,254 | 6,389 | 6,485 | 6,378 | 5,892 |
| 2013 | 5,240 | 5,292 | 6,091 | 6,391 | 7,184 | 6,593 | 6,819 | 6,591 | 6,045 | 6,455 | 5,802 | 5,761 |
| 2014 | 5,644 | 5,250 | 6,456 | 6,225 | 6,502 | 6,667 | 6,546 | 6,896 | 6,298 | 6,648 | 6,146 | 6,309 |
| 2015 | 5,844 | 5,866 | 6,401 | 6,054 | 6,939 | 6,908 | 6,967 | 6,994 | 6,460 | 7,047 | 5,925 | 6,255 |
| 2016 | 5,635 | 5,625 | 6,341 | 6,290 | 7,026 | 7,061 | 6,960 | 7,142 | 6,537 | 6,514 | 6,268 | 6,411 |
| 2017 | 5,598 | 5,246 | 6,285 | 6,346 | 6,729 | 6,549 | 6,841 | 6,645 | 6,055 | 6,551 | 6,168 | 6,392 |
| 2018 | 5,634 | 5,279 | 6,421 | 6,198 | 6,777 | 6,505 | 6,653 | 6,807 | 6,060 | 6,396 | 6,132 | 5,973 |
| 2019 | 5,650 | 5,366 | 6,118 | 6,117 | 6,707 | 6,784 | 6,796 | 7,094 | 6,328 | 6,450 | 6,065 | 6,154 |
| 2020 | 5,666 | 5,509 | 5,055 | 3,325 | 4,778 | 5,703 | 6,064 | 6,064 | 5,214 | 5,830 | 5,066 | 4,785 |
| 2021 | 4,662 | 4,697 | 5,659 | 6,057 | 6,531 | 6,197 | 6,557 | 6,232 | 5,939 | 6,009 | 5,571 | 5,787 |
| 2022 | 5,089 | 5,064 | 5,997 | 5,841 | 6,193 | 6,019 | 5,868 | 6,267 | 5,577 | 5,812 | 5,393 | 5,562 |
| 2023 | 5,135 | 4,870 | 5,472 | 5,541 | 6,173 | 5,981 | 6,198 | 6,280 | 5,806 | 5,908 | 5,674 | 5,616 |
| 2024 | 5,120 | |||||||||||
| - = No Data Reported; -- = Not Applicable; NA = Not Available; W = Withheld to avoid disclosure of individual company data. |
| Release Date: 3/29/2024 |
| Next Release Date: 4/30/2024 |