|
Download Data (XLS File) |
|
||||||||
|
||||||||
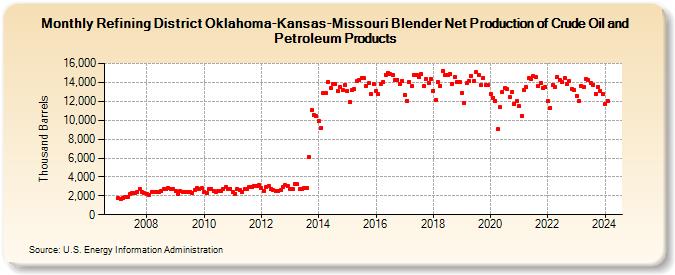
| Refining District Oklahoma-Kansas-Missouri Blender Net Production of Crude Oil and Petroleum Products (Thousand Barrels) | ||||||||
| Year | Jan | Feb | Mar | Apr | May | Jun | Jul | Aug | Sep | Oct | Nov | Dec |
|---|---|---|---|---|---|---|---|---|---|---|---|---|
| 2007 | 1,722 | 1,644 | 1,802 | 1,868 | 1,841 | 2,171 | 2,291 | 2,332 | 2,351 | 2,729 | 2,365 | 2,254 |
| 2008 | 2,242 | 2,104 | 2,449 | 2,414 | 2,417 | 2,380 | 2,548 | 2,670 | 2,731 | 2,832 | 2,707 | 2,745 |
| 2009 | 2,482 | 2,244 | 2,489 | 2,426 | 2,435 | 2,401 | 2,399 | 2,339 | 2,632 | 2,870 | 2,690 | 2,819 |
| 2010 | 2,408 | 2,274 | 2,728 | 2,747 | 2,524 | 2,437 | 2,498 | 2,514 | 2,675 | 2,895 | 2,755 | 2,748 |
| 2011 | 2,388 | 2,212 | 2,692 | 2,666 | 2,456 | 2,677 | 2,706 | 2,937 | 2,903 | 3,080 | 3,016 | 3,101 |
| 2012 | 2,787 | 2,539 | 2,925 | 3,025 | 2,752 | 2,563 | 2,509 | 2,523 | 2,600 | 2,980 | 3,098 | 3,000 |
| 2013 | 2,763 | 2,729 | 3,279 | 3,243 | 2,674 | 2,758 | 2,821 | 2,850 | 6,072 | 11,047 | 10,570 | 10,394 |
| 2014 | 9,879 | 9,210 | 12,915 | 12,896 | 14,083 | 13,412 | 13,879 | 13,825 | 13,048 | 13,550 | 13,194 | 13,712 |
| 2015 | 13,110 | 11,923 | 13,184 | 13,302 | 14,104 | 14,273 | 14,485 | 14,436 | 13,644 | 13,890 | 12,823 | 13,794 |
| 2016 | 13,099 | 12,732 | 13,856 | 14,052 | 14,810 | 15,020 | 14,847 | 14,779 | 14,275 | 14,302 | 13,873 | 14,197 |
| 2017 | 12,682 | 12,061 | 14,085 | 13,609 | 14,760 | 14,807 | 14,579 | 14,916 | 13,591 | 14,348 | 13,980 | 14,356 |
| 2018 | 13,101 | 12,171 | 14,017 | 13,645 | 15,184 | 14,757 | 14,733 | 14,933 | 13,871 | 14,574 | 14,066 | 14,038 |
| 2019 | 12,886 | 11,825 | 13,915 | 14,158 | 14,684 | 14,144 | 15,053 | 14,747 | 13,703 | 14,492 | 13,735 | 13,701 |
| 2020 | 12,727 | 12,382 | 12,036 | 9,022 | 11,351 | 13,008 | 13,399 | 13,281 | 12,463 | 12,987 | 11,702 | 12,008 |
| 2021 | 11,458 | 10,495 | 13,234 | 13,491 | 14,422 | 14,361 | 14,626 | 14,534 | 13,661 | 13,947 | 13,450 | 13,525 |
| 2022 | 12,013 | 11,327 | 13,717 | 13,530 | 14,603 | 14,242 | 14,010 | 14,478 | 13,786 | 14,119 | 13,343 | 13,234 |
| 2023 | 12,596 | 12,043 | 13,656 | 13,482 | 14,390 | 14,241 | 13,955 | 13,750 | 12,805 | 13,529 | 13,067 | 12,743 |
| 2024 | 11,710 | |||||||||||
| - = No Data Reported; -- = Not Applicable; NA = Not Available; W = Withheld to avoid disclosure of individual company data. |
| Release Date: 3/29/2024 |
| Next Release Date: 4/30/2024 |