|
Download Data (XLS File) |
|
||||||||
|
||||||||
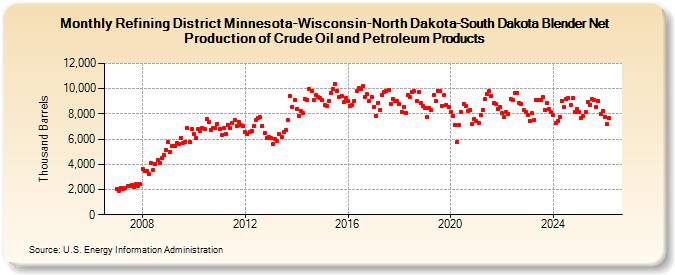
| Refining District Minnesota-Wisconsin-North Dakota-South Dakota Blender Net Production of Crude Oil and Petroleum Products (Thousand Barrels) | ||||||||
| Year | Jan | Feb | Mar | Apr | May | Jun | Jul | Aug | Sep | Oct | Nov | Dec |
|---|---|---|---|---|---|---|---|---|---|---|---|---|
| 2007 | 2,045 | 1,879 | 2,125 | 2,032 | 2,131 | 2,241 | 2,261 | 2,332 | 2,179 | 2,421 | 2,316 | 2,415 |
| 2008 | 3,616 | 3,484 | 3,472 | 3,234 | 4,130 | 3,543 | 4,061 | 4,329 | 4,094 | 4,471 | 4,761 | 5,128 |
| 2009 | 5,764 | 4,996 | 5,457 | 5,413 | 5,671 | 5,650 | 6,075 | 5,674 | 5,806 | 6,865 | 5,743 | 6,794 |
| 2010 | 6,419 | 6,072 | 6,767 | 6,604 | 6,859 | 6,780 | 7,610 | 7,349 | 6,753 | 6,890 | 6,882 | 7,232 |
| 2011 | 6,803 | 6,354 | 6,878 | 6,427 | 7,144 | 6,891 | 7,279 | 7,534 | 7,020 | 7,371 | 7,113 | 7,015 |
| 2012 | 6,592 | 6,369 | 6,528 | 6,679 | 7,007 | 7,523 | 7,677 | 7,723 | 7,074 | 6,508 | 6,064 | 6,198 |
| 2013 | 6,078 | 5,591 | 5,988 | 5,846 | 6,409 | 6,164 | 6,597 | 6,695 | 7,502 | 9,443 | 8,547 | 9,078 |
| 2014 | 8,387 | 7,840 | 8,190 | 8,079 | 9,194 | 9,122 | 9,952 | 9,784 | 9,063 | 9,493 | 9,309 | 9,290 |
| 2015 | 9,081 | 8,680 | 8,649 | 8,999 | 9,653 | 10,000 | 10,358 | 9,813 | 9,351 | 9,448 | 8,919 | 9,270 |
| 2016 | 8,984 | 8,610 | 8,704 | 9,002 | 9,805 | 10,021 | 10,010 | 10,195 | 9,336 | 9,557 | 8,997 | 9,364 |
| 2017 | 8,569 | 7,855 | 8,895 | 8,344 | 9,461 | 9,760 | 9,781 | 9,903 | 8,792 | 9,159 | 9,004 | 9,032 |
| 2018 | 8,762 | 8,184 | 8,564 | 8,063 | 9,501 | 9,371 | 9,736 | 9,786 | 9,024 | 9,717 | 8,833 | 8,636 |
| 2019 | 8,466 | 7,744 | 8,507 | 8,347 | 9,495 | 9,025 | 9,843 | 9,816 | 8,645 | 9,492 | 8,738 | 8,525 |
| 2020 | 8,128 | 7,846 | 7,122 | 5,794 | 7,136 | 8,143 | 8,786 | 8,633 | 8,201 | 8,327 | 7,209 | 7,605 |
| 2021 | 7,408 | 7,260 | 7,909 | 8,314 | 9,180 | 9,572 | 9,804 | 9,444 | 8,844 | 8,759 | 8,423 | 8,526 |
| 2022 | 8,035 | 7,733 | 8,154 | 8,010 | 9,206 | 9,106 | 9,669 | 9,696 | 8,882 | 8,821 | 8,326 | 8,162 |
| 2023 | 7,924 | 7,456 | 8,039 | 7,548 | 9,099 | 9,107 | 9,094 | 9,316 | 8,332 | 8,873 | 8,384 | 8,106 |
| 2024 | 7,884 | |||||||||||
| - = No Data Reported; -- = Not Applicable; NA = Not Available; W = Withheld to avoid disclosure of individual company data. |
| Release Date: 3/29/2024 |
| Next Release Date: 4/30/2024 |