|
Download Data (XLS File) |
|
||||||||
|
||||||||
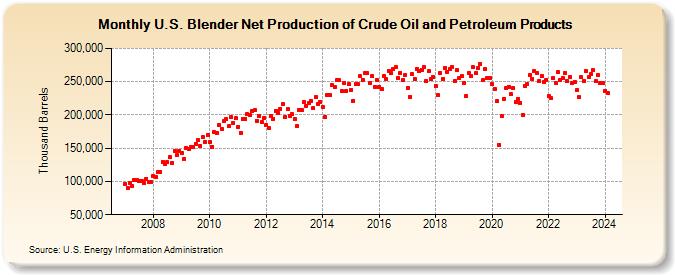
| U.S. Blender Net Production of Crude Oil and Petroleum Products (Thousand Barrels) | ||||||||
| Year | Jan | Feb | Mar | Apr | May | Jun | Jul | Aug | Sep | Oct | Nov | Dec |
|---|---|---|---|---|---|---|---|---|---|---|---|---|
| 2007 | 96,674 | 89,455 | 97,736 | 93,685 | 102,483 | 102,179 | 100,888 | 101,256 | 97,659 | 104,116 | 98,497 | 99,807 |
| 2008 | 108,216 | 107,378 | 113,553 | 114,168 | 128,907 | 125,874 | 128,984 | 136,119 | 128,013 | 145,236 | 139,652 | 146,093 |
| 2009 | 143,242 | 133,931 | 150,975 | 149,168 | 152,045 | 151,983 | 156,890 | 161,841 | 153,818 | 166,563 | 159,957 | 169,791 |
| 2010 | 158,835 | 152,093 | 173,647 | 172,815 | 184,490 | 179,031 | 190,693 | 193,205 | 182,813 | 196,170 | 188,221 | 194,753 |
| 2011 | 182,297 | 172,858 | 194,425 | 193,262 | 200,737 | 199,646 | 206,336 | 206,995 | 191,375 | 198,274 | 188,990 | 195,795 |
| 2012 | 184,966 | 180,798 | 198,425 | 194,414 | 206,388 | 203,265 | 209,271 | 215,940 | 196,969 | 208,549 | 198,947 | 201,347 |
| 2013 | 194,246 | 183,597 | 207,937 | 208,016 | 219,329 | 213,596 | 217,556 | 221,337 | 209,872 | 227,253 | 216,929 | 220,149 |
| 2014 | 211,392 | 196,795 | 229,346 | 229,651 | 244,324 | 241,512 | 251,969 | 252,458 | 236,175 | 248,515 | 235,836 | 246,441 |
| 2015 | 238,183 | 220,948 | 246,281 | 245,776 | 257,965 | 253,160 | 262,532 | 262,628 | 248,714 | 258,477 | 242,195 | 252,397 |
| 2016 | 242,658 | 238,922 | 258,125 | 253,556 | 266,500 | 263,113 | 268,989 | 271,608 | 255,337 | 263,705 | 252,226 | 259,851 |
| 2017 | 240,800 | 227,527 | 260,975 | 254,732 | 268,697 | 265,388 | 268,269 | 272,289 | 251,227 | 265,514 | 254,125 | 256,654 |
| 2018 | 243,653 | 229,274 | 262,799 | 253,516 | 271,096 | 264,902 | 268,843 | 271,814 | 251,285 | 266,822 | 255,151 | 258,499 |
| 2019 | 247,507 | 228,192 | 262,450 | 258,124 | 271,479 | 262,353 | 271,061 | 276,350 | 252,456 | 268,438 | 255,210 | 255,436 |
| 2020 | 246,169 | 239,546 | 220,184 | 155,285 | 197,808 | 224,529 | 239,852 | 242,676 | 230,900 | 240,249 | 219,352 | 224,616 |
| 2021 | 218,466 | 200,112 | 243,950 | 246,487 | 259,593 | 254,494 | 265,454 | 263,681 | 251,273 | 258,617 | 249,311 | 252,789 |
| 2022 | 228,643 | 224,889 | 255,079 | 247,960 | 263,912 | 252,635 | 255,458 | 263,341 | 250,377 | 257,361 | 247,830 | 249,807 |
| 2023 | 237,325 | 226,431 | 256,355 | 250,622 | 265,715 | 256,949 | 261,558 | 267,033 | 250,313 | 259,789 | 247,713 | 247,821 |
| 2024 | 236,393 | |||||||||||
| - = No Data Reported; -- = Not Applicable; NA = Not Available; W = Withheld to avoid disclosure of individual company data. |
| Release Date: 3/29/2024 |
| Next Release Date: 4/30/2024 |
Referring Pages: