|
Download Data (XLS File) |
|
||||||||
|
||||||||
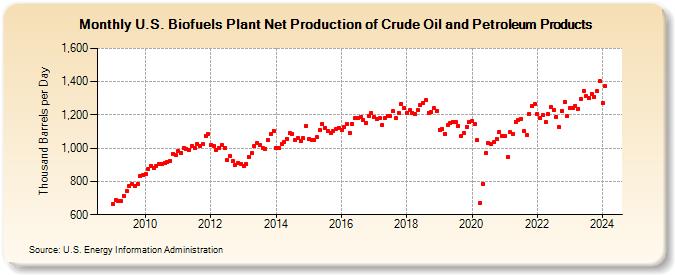
| U.S. Biofuels Plant Net Production of Crude Oil and Petroleum Products (Thousand Barrels per Day) | ||||||||
| Year | Jan | Feb | Mar | Apr | May | Jun | Jul | Aug | Sep | Oct | Nov | Dec |
|---|---|---|---|---|---|---|---|---|---|---|---|---|
| 2009 | 663 | 686 | 684 | 681 | 714 | 741 | 773 | 783 | 771 | 785 | 833 | 838 |
| 2010 | 846 | 874 | 895 | 878 | 893 | 905 | 906 | 911 | 915 | 924 | 967 | 961 |
| 2011 | 982 | 972 | 1,002 | 996 | 992 | 1,015 | 1,004 | 1,027 | 1,011 | 1,023 | 1,076 | 1,085 |
| 2012 | 1,022 | 1,013 | 991 | 1,002 | 1,017 | 1,003 | 928 | 954 | 920 | 901 | 913 | 904 |
| 2013 | 891 | 905 | 950 | 971 | 1,011 | 1,034 | 1,021 | 1,004 | 998 | 1,052 | 1,083 | 1,102 |
| 2014 | 1,001 | 1,000 | 1,026 | 1,040 | 1,057 | 1,091 | 1,088 | 1,051 | 1,059 | 1,044 | 1,059 | 1,134 |
| 2015 | 1,055 | 1,048 | 1,052 | 1,065 | 1,107 | 1,148 | 1,124 | 1,103 | 1,090 | 1,104 | 1,117 | 1,124 |
| 2016 | 1,109 | 1,128 | 1,146 | 1,094 | 1,146 | 1,180 | 1,180 | 1,190 | 1,167 | 1,153 | 1,195 | 1,212 |
| 2017 | 1,187 | 1,173 | 1,179 | 1,142 | 1,179 | 1,191 | 1,193 | 1,222 | 1,180 | 1,214 | 1,268 | 1,240 |
| 2018 | 1,210 | 1,228 | 1,214 | 1,205 | 1,230 | 1,260 | 1,273 | 1,289 | 1,214 | 1,220 | 1,240 | 1,222 |
| 2019 | 1,112 | 1,115 | 1,087 | 1,138 | 1,151 | 1,159 | 1,155 | 1,133 | 1,071 | 1,093 | 1,129 | 1,157 |
| 2020 | 1,161 | 1,144 | 1,049 | 671 | 787 | 969 | 1,033 | 1,025 | 1,036 | 1,058 | 1,099 | 1,074 |
| 2021 | 1,073 | 947 | 1,095 | 1,086 | 1,159 | 1,170 | 1,177 | 1,101 | 1,079 | 1,208 | 1,256 | 1,263 |
| 2022 | 1,206 | 1,183 | 1,197 | 1,157 | 1,206 | 1,246 | 1,228 | 1,189 | 1,126 | 1,225 | 1,280 | 1,191 |
| 2023 | 1,240 | 1,240 | 1,254 | 1,238 | 1,296 | 1,345 | 1,313 | 1,303 | 1,327 | 1,309 | 1,341 | 1,401 |
| 2024 | 1,272 | |||||||||||
| - = No Data Reported; -- = Not Applicable; NA = Not Available; W = Withheld to avoid disclosure of individual company data. |
| Release Date: 3/29/2024 |
| Next Release Date: 4/30/2024 |