|
Download Data (XLS File) |
|
||||||||
|
||||||||
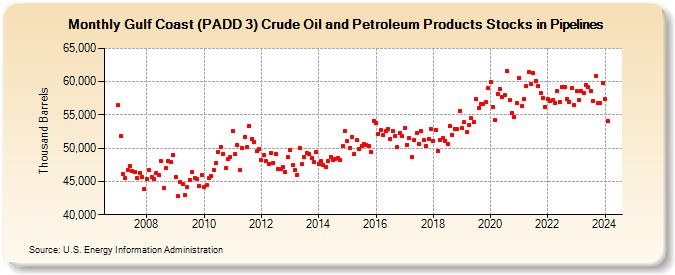
| Gulf Coast (PADD 3) Crude Oil and Petroleum Products Stocks in Pipelines (Thousand Barrels) | ||||||||
| Year | Jan | Feb | Mar | Apr | May | Jun | Jul | Aug | Sep | Oct | Nov | Dec |
|---|---|---|---|---|---|---|---|---|---|---|---|---|
| 2007 | 56,473 | 51,894 | 46,062 | 45,449 | 46,767 | 47,295 | 46,529 | 46,489 | 45,495 | 46,300 | 45,689 | 43,849 |
| 2008 | 45,430 | 46,731 | 45,720 | 45,312 | 46,243 | 45,963 | 48,015 | 44,088 | 46,948 | 48,088 | 47,941 | 49,034 |
| 2009 | 45,646 | 42,828 | 44,927 | 44,638 | 42,940 | 44,115 | 45,272 | 46,399 | 45,533 | 45,323 | 44,369 | 45,994 |
| 2010 | 44,207 | 44,472 | 45,474 | 45,768 | 46,791 | 47,779 | 49,455 | 50,124 | 49,188 | 46,973 | 48,332 | 48,675 |
| 2011 | 52,582 | 49,091 | 50,466 | 46,744 | 50,098 | 51,735 | 50,244 | 53,374 | 51,360 | 50,941 | 49,552 | 49,878 |
| 2012 | 48,174 | 48,981 | 48,011 | 47,637 | 49,283 | 47,821 | 49,163 | 46,803 | 46,848 | 47,180 | 46,442 | 48,624 |
| 2013 | 49,739 | 47,432 | 46,652 | 46,039 | 50,086 | 47,557 | 48,603 | 49,345 | 49,114 | 48,471 | 47,928 | 49,429 |
| 2014 | 47,689 | 48,085 | 47,405 | 47,176 | 48,138 | 48,647 | 48,186 | 48,442 | 48,468 | 48,287 | 50,269 | 52,581 |
| 2015 | 51,079 | 50,097 | 51,733 | 49,143 | 51,298 | 49,943 | 50,292 | 50,684 | 50,525 | 50,295 | 49,443 | 54,137 |
| 2016 | 53,825 | 52,172 | 52,743 | 51,919 | 52,512 | 52,911 | 51,454 | 52,609 | 51,887 | 50,112 | 52,233 | 51,759 |
| 2017 | 52,983 | 50,479 | 51,529 | 48,627 | 51,283 | 52,213 | 50,598 | 52,555 | 51,265 | 50,351 | 51,315 | 52,935 |
| 2018 | 51,148 | 52,808 | 49,595 | 51,232 | 51,477 | 51,095 | 50,629 | 53,371 | 51,951 | 52,863 | 52,870 | 55,515 |
| 2019 | 52,959 | 53,923 | 52,368 | 53,558 | 54,501 | 53,904 | 57,378 | 55,992 | 56,703 | 56,578 | 56,926 | 59,086 |
| 2020 | 59,945 | 56,245 | 54,210 | 58,161 | 58,948 | 57,673 | 57,939 | 61,663 | 57,209 | 55,261 | 54,730 | 56,733 |
| 2021 | 60,580 | 56,321 | 57,432 | 59,301 | 61,415 | 59,588 | 61,290 | 60,144 | 59,322 | 58,317 | 57,491 | 56,244 |
| 2022 | 57,353 | 57,112 | 57,229 | 56,844 | 58,647 | 56,946 | 59,209 | 59,203 | 57,400 | 57,006 | 59,040 | 56,497 |
| 2023 | 58,622 | 57,242 | 58,548 | 58,281 | 59,534 | 59,144 | 58,581 | 57,121 | 60,854 | 56,775 | 56,806 | 59,770 |
| 2024 | 57,423 | |||||||||||
| - = No Data Reported; -- = Not Applicable; NA = Not Available; W = Withheld to avoid disclosure of individual company data. |
| Release Date: 3/29/2024 |
| Next Release Date: 4/30/2024 |