|
Download Data (XLS File) |
|
||||||||
|
||||||||
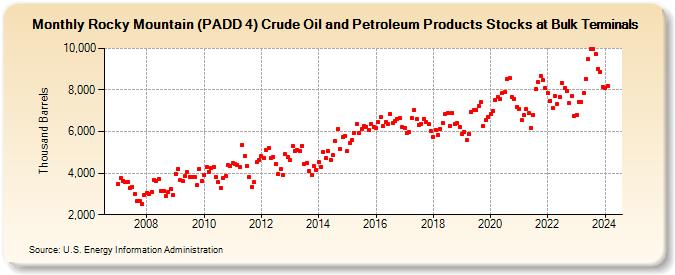
| Rocky Mountain (PADD 4) Crude Oil and Petroleum Products Stocks at Bulk Terminals (Thousand Barrels) | ||||||||
| Year | Jan | Feb | Mar | Apr | May | Jun | Jul | Aug | Sep | Oct | Nov | Dec |
|---|---|---|---|---|---|---|---|---|---|---|---|---|
| 2007 | 3,487 | 3,751 | 3,622 | 3,560 | 3,596 | 3,304 | 3,329 | 2,993 | 2,661 | 2,636 | 2,497 | 2,970 |
| 2008 | 3,049 | 3,005 | 3,110 | 3,692 | 3,624 | 3,703 | 3,142 | 3,134 | 2,902 | 3,112 | 3,241 | 2,955 |
| 2009 | 3,971 | 4,176 | 3,660 | 3,641 | 3,852 | 4,037 | 3,816 | 3,806 | 3,816 | 3,407 | 4,212 | 3,599 |
| 2010 | 3,926 | 4,285 | 4,074 | 4,266 | 4,309 | 3,805 | 3,557 | 3,305 | 3,786 | 3,877 | 4,375 | 4,353 |
| 2011 | 4,476 | 4,459 | 4,415 | 4,285 | 5,371 | 4,803 | 4,360 | 3,795 | 3,345 | 3,572 | 4,521 | 4,647 |
| 2012 | 4,829 | 4,721 | 5,134 | 5,232 | 4,723 | 4,780 | 4,450 | 3,950 | 4,188 | 3,887 | 4,900 | 4,791 |
| 2013 | 4,638 | 5,307 | 5,074 | 5,125 | 5,053 | 5,322 | 4,434 | 4,489 | 4,113 | 3,909 | 4,334 | 4,154 |
| 2014 | 4,526 | 4,308 | 5,013 | 4,706 | 5,064 | 4,629 | 4,855 | 5,526 | 6,117 | 5,159 | 5,728 | 5,799 |
| 2015 | 5,052 | 5,436 | 5,610 | 5,928 | 6,343 | 5,928 | 6,106 | 6,272 | 6,236 | 6,079 | 6,366 | 6,214 |
| 2016 | 6,179 | 6,454 | 6,682 | 6,262 | 6,463 | 6,367 | 6,840 | 6,412 | 6,484 | 6,625 | 6,630 | 6,202 |
| 2017 | 6,187 | 5,931 | 5,974 | 6,658 | 7,031 | 6,598 | 6,310 | 6,378 | 6,592 | 6,444 | 6,350 | 6,033 |
| 2018 | 5,750 | 6,077 | 5,823 | 6,105 | 6,400 | 6,838 | 6,901 | 6,270 | 6,895 | 6,344 | 6,399 | 6,212 |
| 2019 | 5,860 | 5,984 | 5,570 | 5,894 | 6,930 | 7,013 | 7,060 | 7,221 | 7,404 | 6,266 | 6,555 | 6,692 |
| 2020 | 6,852 | 7,003 | 7,495 | 7,639 | 7,560 | 7,867 | 7,903 | 8,520 | 8,568 | 7,672 | 7,572 | 7,195 |
| 2021 | 7,097 | 6,537 | 6,777 | 7,066 | 6,873 | 6,193 | 6,798 | 8,054 | 8,361 | 8,687 | 8,464 | 8,098 |
| 2022 | 7,854 | 7,486 | 7,138 | 7,704 | 7,332 | 7,678 | 8,358 | 8,083 | 7,954 | 7,358 | 7,718 | 6,737 |
| 2023 | 6,826 | 7,457 | 7,432 | 7,832 | 8,502 | 9,393 | 9,882 | 9,857 | 9,719 | 9,023 | 8,879 | 8,223 |
| 2024 | 8,091 | 8,202 | 8,418 | 8,793 | 9,071 | 9,043 | ||||||
| - = No Data Reported; -- = Not Applicable; NA = Not Available; W = Withheld to avoid disclosure of individual company data. |
| Release Date: 8/30/2024 |
| Next Release Date: 9/30/2024 |