|
Download Data (XLS File) |
|
||||||||
|
||||||||
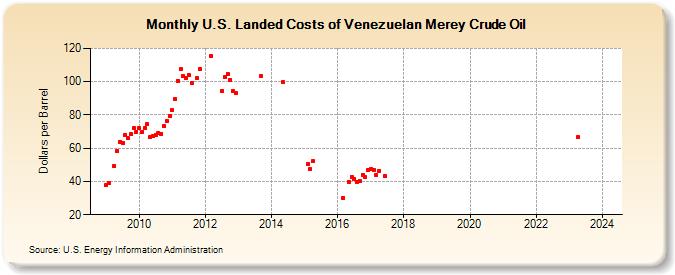
| U.S. Landed Costs of Venezuelan Merey Crude Oil (Dollars per Barrel) | ||||||||
| Year | Jan | Feb | Mar | Apr | May | Jun | Jul | Aug | Sep | Oct | Nov | Dec |
|---|---|---|---|---|---|---|---|---|---|---|---|---|
| 2009 | 37.66 | 39.18 | W | 49.22 | 58.30 | 64.00 | 63.21 | 68.17 | 65.89 | 68.26 | 72.03 | 69.99 |
| 2010 | 71.91 | 69.74 | 71.96 | 74.27 | 66.78 | 67.17 | 68.01 | 69.23 | 68.77 | 73.47 | 76.27 | 79.56 |
| 2011 | 82.80 | 89.36 | 100.56 | 107.43 | 103.40 | 102.16 | 103.80 | 98.92 | W | 101.91 | 107.71 | W |
| 2012 | W | W | 115.51 | W | W | W | 94.66 | 102.57 | 104.51 | 101.23 | 94.37 | 92.97 |
| 2013 | W | W | W | W | W | W | W | W | 103.14 | W | W | W |
| 2014 | W | W | W | W | 99.60 | W | W | W | W | W | W | W |
| 2015 | W | 50.43 | 47.50 | 52.11 | W | W | W | W | W | W | W | W |
| 2016 | W | W | 30.21 | W | 39.92 | 42.92 | 41.62 | 39.95 | 40.29 | 44.07 | 42.50 | 46.60 |
| 2017 | 47.49 | 47.09 | 43.92 | 46.49 | W | 43.21 | W | W | W | W | W | W |
| 2018 | W | W | W | W | W | W | W | W | W | W | ||
| 2019 | W | |||||||||||
| 2023 | W | 66.53 | W | W | W | W | W | W | W | |||
| 2024 | W | |||||||||||
| - = No Data Reported; -- = Not Applicable; NA = Not Available; W = Withheld to avoid disclosure of individual company data. |
| Release Date: 5/1/2024 |
| Next Release Date: 6/3/2024 |