|
Download Data (XLS File) |
|
||||||||
|
||||||||
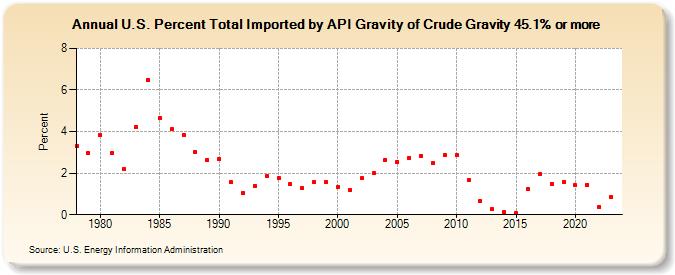
| U.S. Percent Total Imported by API Gravity of Crude Gravity 45.1% or more (Percent) | ||||||||
| Decade | Year-0 | Year-1 | Year-2 | Year-3 | Year-4 | Year-5 | Year-6 | Year-7 | Year-8 | Year-9 |
|---|---|---|---|---|---|---|---|---|---|---|
| 1970's | 3.31 | 2.96 | ||||||||
| 1980's | 3.85 | 2.98 | 2.20 | 4.23 | 6.48 | 4.65 | 4.11 | 3.85 | 3.02 | 2.64 |
| 1990's | 2.67 | 1.55 | 1.04 | 1.39 | 1.87 | 1.76 | 1.47 | 1.27 | 1.57 | 1.57 |
| 2000's | 1.35 | 1.21 | 1.75 | 1.99 | 2.64 | 2.55 | 2.74 | 2.84 | 2.47 | 2.88 |
| 2010's | 2.86 | 1.68 | 0.65 | 0.27 | 0.11 | 0.06 | 1.22 | 1.95 | 1.49 | 1.58 |
| 2020's | 1.41 | 1.45 | 0.38 | 0.82 |
| - = No Data Reported; -- = Not Applicable; NA = Not Available; W = Withheld to avoid disclosure of individual company data. |
| Release Date: 4/1/2024 |
| Next Release Date: 5/1/2024 |