|
Download Data (XLS File) |
|
||||||||
|
||||||||
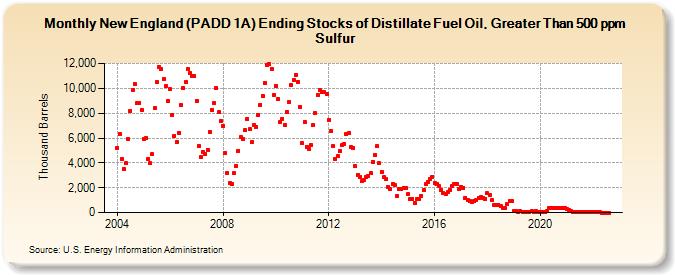
| New England (PADD 1A) Ending Stocks of Distillate Fuel Oil, Greater Than 500 ppm Sulfur (Thousand Barrels) | ||||||||
| Year | Jan | Feb | Mar | Apr | May | Jun | Jul | Aug | Sep | Oct | Nov | Dec |
|---|---|---|---|---|---|---|---|---|---|---|---|---|
| 2004 | 5,228 | 6,329 | 4,315 | 3,515 | 3,953 | 5,931 | 8,191 | 9,868 | 10,322 | 8,793 | 8,859 | 8,292 |
| 2005 | 5,897 | 6,007 | 4,349 | 3,957 | 4,697 | 8,401 | 10,485 | 11,705 | 11,526 | 10,757 | 10,182 | 8,983 |
| 2006 | 9,924 | 7,868 | 6,190 | 5,690 | 6,433 | 8,619 | 10,018 | 10,509 | 11,557 | 11,224 | 11,004 | 10,962 |
| 2007 | 9,019 | 5,348 | 4,461 | 4,897 | 4,744 | 5,067 | 6,499 | 8,258 | 8,799 | 10,045 | 8,071 | 7,397 |
| 2008 | 6,991 | 4,790 | 3,183 | 2,368 | 2,308 | 3,154 | 3,730 | 4,977 | 6,082 | 5,893 | 6,624 | 7,540 |
| 2009 | 6,686 | 5,651 | 7,085 | 6,920 | 7,859 | 8,689 | 9,414 | 10,443 | 11,863 | 11,947 | 11,569 | 9,481 |
| 2010 | 10,196 | 9,149 | 7,306 | 7,554 | 7,063 | 8,119 | 8,906 | 10,249 | 10,701 | 11,093 | 10,541 | 8,536 |
| 2011 | 5,569 | 7,306 | 5,261 | 5,142 | 5,434 | 7,014 | 7,989 | 9,478 | 9,857 | 9,678 | 9,673 | 9,559 |
| 2012 | 7,470 | 6,591 | 5,327 | 4,312 | 4,560 | 4,937 | 5,406 | 5,538 | 6,304 | 6,373 | 5,290 | 5,199 |
| 2013 | 3,710 | 3,055 | 2,839 | 2,504 | 2,608 | 2,824 | 2,916 | 3,146 | 4,110 | 4,645 | 5,319 | 3,958 |
| 2014 | 3,266 | 2,838 | 2,676 | 2,065 | 1,865 | 2,300 | 2,182 | 1,364 | 1,862 | 1,862 | 1,993 | 1,987 |
| 2015 | 1,457 | 1,064 | 1,074 | 808 | 1,086 | 1,119 | 1,336 | 1,805 | 2,294 | 2,466 | 2,707 | 2,895 |
| 2016 | 2,389 | 2,280 | 2,108 | 1,798 | 1,588 | 1,481 | 1,649 | 1,817 | 2,144 | 2,305 | 2,322 | 1,860 |
| 2017 | 2,087 | 1,998 | 1,207 | 981 | 931 | 890 | 907 | 1,036 | 1,211 | 1,219 | 1,185 | 1,116 |
| 2018 | 1,536 | 1,403 | 974 | 571 | 612 | 648 | 515 | 393 | 366 | 697 | 891 | 931 |
| 2019 | 120 | 124 | 78 | 96 | 81 | 70 | 65 | 70 | 90 | 75 | 88 | 76 |
| 2020 | 67 | 55 | 80 | 90 | 400 | 393 | 387 | 384 | 369 | 367 | 363 | 353 |
| 2021 | 279 | 242 | 137 | 66 | 56 | 52 | 49 | 47 | 42 | 36 | 26 | 22 |
| 2022 | 20 | 20 | 20 | 5 | 3 | 3 | 2 | 1 | ||||
| - = No Data Reported; -- = Not Applicable; NA = Not Available; W = Withheld to avoid disclosure of individual company data. |
| Release Date: 3/29/2024 |
| Next Release Date: 4/30/2024 |