|
Download Data (XLS File) |
|
||||||||||
|
||||||||||
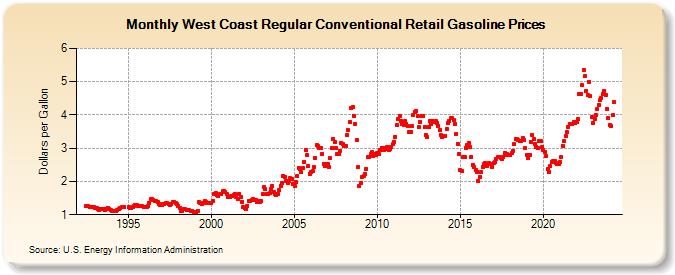
| West Coast Regular Conventional Retail Gasoline Prices (Dollars per Gallon) | ||||||||||
| Year | Jan | Feb | Mar | Apr | May | Jun | Jul | Aug | Sep | Oct | Nov | Dec |
|---|---|---|---|---|---|---|---|---|---|---|---|---|
| 1992 | NA | 1.251 | 1.266 | 1.254 | 1.238 | 1.230 | 1.244 | 1.221 | ||||
| 1993 | 1.210 | 1.195 | 1.163 | 1.155 | 1.175 | 1.186 | 1.175 | 1.156 | 1.161 | 1.212 | 1.177 | 1.131 |
| 1994 | 1.108 | 1.108 | 1.112 | 1.123 | 1.146 | 1.170 | 1.196 | 1.223 | 1.225 | 1.229 | NA | NA |
| 1995 | 1.229 | 1.212 | 1.205 | 1.221 | 1.264 | 1.278 | 1.280 | 1.276 | 1.272 | 1.264 | 1.256 | 1.246 |
| 1996 | 1.239 | 1.226 | 1.253 | 1.362 | 1.477 | 1.466 | 1.441 | 1.424 | 1.398 | 1.382 | 1.333 | 1.286 |
| 1997 | 1.296 | 1.326 | 1.335 | 1.350 | 1.338 | 1.308 | 1.282 | 1.313 | 1.384 | 1.383 | 1.359 | 1.313 |
| 1998 | 1.268 | 1.202 | 1.123 | 1.126 | 1.165 | 1.160 | 1.152 | 1.140 | 1.129 | 1.123 | 1.111 | 1.088 |
| 1999 | 1.067 | 1.037 | 1.114 | 1.388 | 1.343 | 1.312 | 1.361 | 1.416 | 1.395 | 1.366 | 1.347 | 1.357 |
| 2000 | 1.357 | 1.413 | 1.613 | 1.646 | 1.580 | 1.561 | 1.627 | 1.629 | 1.705 | 1.707 | 1.674 | 1.616 |
| 2001 | 1.530 | 1.529 | 1.549 | 1.553 | 1.599 | 1.617 | 1.539 | 1.478 | 1.633 | 1.546 | 1.395 | 1.221 |
| 2002 | 1.191 | 1.186 | 1.266 | 1.415 | 1.423 | 1.443 | 1.460 | 1.451 | 1.431 | 1.397 | 1.401 | 1.372 |
| 2003 | 1.406 | 1.611 | 1.840 | 1.764 | 1.633 | 1.634 | 1.643 | 1.766 | 1.864 | 1.681 | 1.637 | 1.588 |
| 2004 | 1.633 | 1.731 | 1.859 | 1.956 | 2.174 | 2.143 | 2.005 | 1.965 | 2.004 | 2.091 | 2.065 | 1.928 |
| 2005 | 1.849 | 1.984 | 2.157 | 2.404 | 2.379 | 2.284 | 2.406 | 2.587 | 2.935 | 2.799 | 2.451 | 2.235 |
| 2006 | 2.292 | 2.321 | 2.430 | 2.717 | 3.090 | 3.053 | 3.001 | 3.016 | 2.837 | 2.530 | 2.457 | 2.537 |
| 2007 | 2.525 | 2.426 | 2.695 | 3.018 | 3.284 | 3.174 | 2.995 | 2.828 | 2.824 | 2.929 | 3.154 | 3.116 |
| 2008 | 3.080 | 3.078 | 3.383 | 3.543 | 3.785 | 4.199 | 4.234 | 3.961 | 3.738 | 3.258 | 2.427 | 1.877 |
| 2009 | 1.955 | 2.145 | 2.155 | 2.232 | 2.380 | 2.738 | 2.738 | 2.825 | 2.884 | 2.759 | 2.816 | 2.787 |
| 2010 | 2.849 | 2.821 | 2.931 | 3.016 | 3.011 | 2.953 | 2.987 | 3.032 | 2.951 | 2.988 | 3.035 | 3.114 |
| 2011 | 3.196 | 3.351 | 3.685 | 3.881 | 3.961 | 3.824 | 3.724 | 3.711 | 3.804 | 3.740 | 3.656 | 3.472 |
| 2012 | 3.480 | 3.658 | 3.989 | 4.087 | 4.115 | 3.967 | 3.622 | 3.796 | 3.964 | 3.981 | 3.651 | 3.406 |
| 2013 | 3.332 | 3.631 | 3.823 | 3.724 | 3.806 | 3.776 | 3.804 | 3.771 | 3.679 | 3.541 | 3.384 | 3.341 |
| 2014 | 3.357 | 3.377 | 3.583 | 3.750 | 3.828 | 3.893 | 3.906 | 3.836 | 3.729 | 3.437 | 3.140 | 2.829 |
| 2015 | 2.357 | 2.312 | 2.733 | 2.720 | 3.016 | 3.097 | 3.143 | 3.028 | 2.742 | 2.502 | 2.424 | 2.354 |
| 2016 | 2.294 | 2.022 | 2.126 | 2.284 | 2.435 | 2.522 | 2.543 | 2.455 | 2.510 | 2.541 | 2.512 | 2.448 |
| 2017 | 2.552 | 2.577 | 2.665 | 2.733 | 2.742 | 2.713 | 2.668 | 2.720 | 2.865 | 2.783 | 2.830 | 2.795 |
| 2018 | 2.784 | 2.844 | 2.916 | 3.114 | 3.262 | 3.285 | 3.243 | 3.206 | 3.212 | 3.295 | 3.233 | 2.997 |
| 2019 | 2.798 | 2.710 | 2.793 | 3.186 | 3.395 | 3.268 | 3.120 | 3.037 | 3.018 | 3.210 | 3.222 | 3.042 |
| 2020 | 2.931 | 2.894 | 2.758 | 2.361 | 2.276 | 2.450 | 2.585 | 2.618 | 2.612 | 2.555 | 2.521 | 2.513 |
| 2021 | 2.577 | 2.723 | 3.077 | 3.204 | 3.359 | 3.475 | 3.641 | 3.731 | 3.719 | 3.723 | 3.774 | 3.753 |
| 2022 | 3.796 | 3.865 | 4.622 | 4.640 | 4.885 | 5.363 | 5.156 | 4.729 | 4.588 | 4.995 | 4.561 | 3.936 |
| 2023 | 3.763 | 3.887 | 4.003 | 4.168 | 4.299 | 4.434 | 4.507 | 4.640 | 4.729 | 4.609 | 4.192 | 3.903 |
| 2024 | 3.704 | 3.665 | 3.995 | 4.385 | 4.347 | 4.091 | 3.952 | 3.857 | ||||
| - = No Data Reported; -- = Not Applicable; NA = Not Available; W = Withheld to avoid disclosure of individual company data. |
| Release Date: 9/16/2024 |
| Next Release Date: 9/23/2024 |