|
Download Data (XLS File) |
|
||||||||||
|
||||||||||
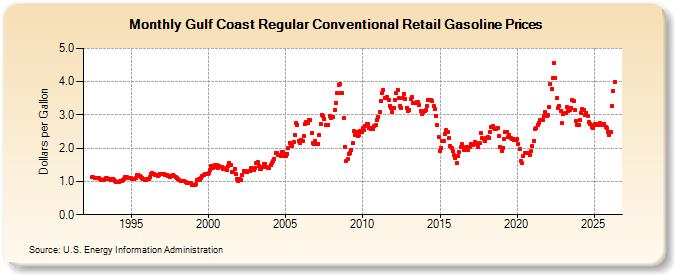
| Gulf Coast Regular Conventional Retail Gasoline Prices (Dollars per Gallon) | ||||||||||
| Year | Jan | Feb | Mar | Apr | May | Jun | Jul | Aug | Sep | Oct | Nov | Dec |
|---|---|---|---|---|---|---|---|---|---|---|---|---|
| 1992 | NA | 1.123 | 1.124 | 1.113 | 1.108 | 1.095 | 1.091 | 1.066 | ||||
| 1993 | 1.053 | 1.040 | 1.047 | 1.074 | 1.092 | 1.092 | 1.082 | 1.066 | 1.052 | 1.080 | 1.053 | 1.010 |
| 1994 | 0.984 | 0.986 | 0.983 | 1.011 | 1.025 | 1.051 | 1.076 | 1.124 | 1.124 | 1.101 | 1.104 | 1.098 |
| 1995 | 1.087 | 1.075 | 1.067 | 1.109 | 1.186 | 1.202 | 1.165 | 1.124 | 1.100 | 1.073 | 1.048 | 1.054 |
| 1996 | 1.077 | 1.073 | 1.124 | 1.219 | 1.252 | 1.232 | 1.200 | 1.183 | 1.177 | 1.179 | 1.213 | 1.225 |
| 1997 | 1.220 | 1.221 | 1.196 | 1.182 | 1.167 | 1.162 | 1.145 | 1.178 | 1.184 | 1.159 | 1.132 | 1.102 |
| 1998 | 1.071 | 1.032 | 1.003 | 1.006 | 1.007 | 1.000 | 0.989 | 0.966 | 0.942 | 0.965 | 0.940 | 0.895 |
| 1999 | 0.892 | 0.883 | 0.922 | 1.046 | 1.060 | 1.053 | 1.090 | 1.151 | 1.194 | 1.209 | 1.210 | 1.237 |
| 2000 | 1.243 | 1.331 | 1.471 | 1.415 | 1.421 | 1.497 | 1.503 | 1.416 | 1.458 | 1.442 | 1.424 | 1.361 |
| 2001 | 1.373 | 1.396 | 1.341 | 1.464 | 1.563 | 1.491 | 1.292 | 1.295 | 1.389 | 1.228 | 1.086 | 1.027 |
| 2002 | 1.062 | 1.057 | 1.185 | 1.324 | 1.316 | 1.293 | 1.298 | 1.307 | 1.321 | 1.391 | 1.366 | 1.339 |
| 2003 | 1.407 | 1.550 | 1.588 | 1.478 | 1.379 | 1.385 | 1.430 | 1.516 | 1.533 | 1.430 | 1.404 | 1.402 |
| 2004 | 1.505 | 1.557 | 1.621 | 1.689 | 1.865 | 1.862 | 1.809 | 1.793 | 1.775 | 1.894 | 1.879 | 1.753 |
| 2005 | 1.758 | 1.828 | 2.002 | 2.167 | 2.063 | 2.068 | 2.197 | 2.399 | 2.758 | 2.703 | 2.217 | 2.141 |
| 2006 | 2.256 | 2.203 | 2.370 | 2.719 | 2.777 | 2.750 | 2.858 | 2.853 | 2.469 | 2.147 | 2.120 | 2.205 |
| 2007 | 2.117 | 2.134 | 2.411 | 2.722 | 3.000 | 2.953 | 2.875 | 2.707 | 2.708 | 2.710 | 2.971 | 2.898 |
| 2008 | 2.936 | 2.941 | 3.157 | 3.363 | 3.663 | 3.911 | 3.939 | 3.659 | 3.656 | 2.909 | 2.049 | 1.609 |
| 2009 | 1.676 | 1.827 | 1.869 | 1.960 | 2.163 | 2.505 | 2.397 | 2.491 | 2.379 | 2.409 | 2.529 | 2.486 |
| 2010 | 2.597 | 2.533 | 2.673 | 2.741 | 2.741 | 2.613 | 2.585 | 2.598 | 2.565 | 2.656 | 2.690 | 2.846 |
| 2011 | 2.952 | 3.073 | 3.432 | 3.655 | 3.747 | 3.523 | 3.518 | 3.524 | 3.443 | 3.280 | 3.193 | 3.073 |
| 2012 | 3.208 | 3.450 | 3.656 | 3.758 | 3.514 | 3.282 | 3.204 | 3.506 | 3.638 | 3.493 | 3.220 | 3.110 |
| 2013 | 3.155 | 3.464 | 3.525 | 3.363 | 3.344 | 3.349 | 3.392 | 3.385 | 3.308 | 3.119 | 3.042 | 3.087 |
| 2014 | 3.104 | 3.142 | 3.272 | 3.453 | 3.444 | 3.444 | 3.410 | 3.271 | 3.173 | 2.971 | 2.698 | 2.322 |
| 2015 | 1.912 | 2.013 | 2.206 | 2.218 | 2.437 | 2.538 | 2.484 | 2.303 | 2.072 | 2.015 | 1.906 | 1.786 |
| 2016 | 1.694 | 1.560 | 1.754 | 1.877 | 2.029 | 2.113 | 2.021 | 1.959 | 1.989 | 2.047 | 1.957 | 2.039 |
| 2017 | 2.137 | 2.081 | 2.086 | 2.186 | 2.161 | 2.114 | 2.046 | 2.146 | 2.470 | 2.294 | 2.291 | 2.219 |
| 2018 | 2.295 | 2.332 | 2.316 | 2.501 | 2.643 | 2.656 | 2.593 | 2.588 | 2.572 | 2.608 | 2.372 | 2.050 |
| 2019 | 1.928 | 2.016 | 2.263 | 2.489 | 2.494 | 2.348 | 2.410 | 2.301 | 2.271 | 2.287 | 2.252 | 2.246 |
| 2020 | 2.264 | 2.136 | 1.970 | 1.610 | 1.562 | 1.770 | 1.868 | 1.857 | 1.865 | 1.853 | 1.798 | 1.901 |
| 2021 | 2.054 | 2.218 | 2.571 | 2.608 | 2.712 | 2.758 | 2.838 | 2.833 | 2.841 | 2.981 | 3.074 | 2.959 |
| 2022 | 2.991 | 3.225 | 3.937 | 3.791 | 4.099 | 4.562 | 4.111 | 3.504 | 3.194 | 3.266 | 3.113 | 2.749 |
| 2023 | 3.028 | 3.047 | 3.064 | 3.242 | 3.107 | 3.139 | 3.209 | 3.443 | 3.411 | 3.139 | 2.827 | 2.683 |
| 2024 | 2.704 | 2.855 | 3.047 | 3.163 | 3.149 | 3.009 | 3.066 | 2.978 | ||||
| - = No Data Reported; -- = Not Applicable; NA = Not Available; W = Withheld to avoid disclosure of individual company data. |
| Release Date: 9/16/2024 |
| Next Release Date: 9/23/2024 |