|
Download Data (XLS File) |
|
||||||||||
|
||||||||||
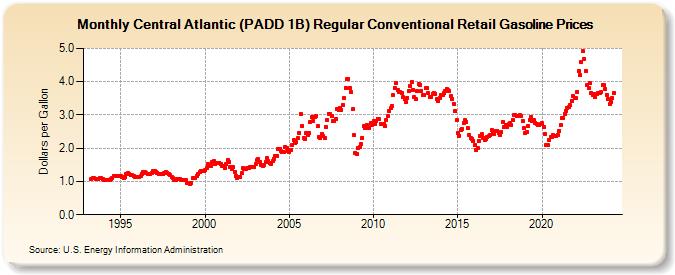
| Central Atlantic (PADD 1B) Regular Conventional Retail Gasoline Prices (Dollars per Gallon) | ||||||||||
| Year | Jan | Feb | Mar | Apr | May | Jun | Jul | Aug | Sep | Oct | Nov | Dec |
|---|---|---|---|---|---|---|---|---|---|---|---|---|
| 1993 | 1.074 | 1.092 | 1.096 | 1.088 | 1.074 | 1.061 | 1.102 | 1.090 | 1.061 | |||
| 1994 | 1.036 | 1.038 | 1.033 | 1.033 | 1.056 | 1.088 | 1.114 | 1.158 | 1.160 | 1.151 | 1.175 | 1.175 |
| 1995 | 1.149 | 1.124 | 1.109 | 1.125 | 1.210 | 1.244 | 1.227 | 1.200 | 1.183 | 1.158 | 1.122 | 1.132 |
| 1996 | 1.142 | 1.131 | 1.151 | 1.232 | 1.295 | 1.282 | 1.254 | 1.230 | 1.226 | 1.232 | 1.268 | 1.308 |
| 1997 | 1.312 | 1.297 | 1.256 | 1.224 | 1.231 | 1.233 | 1.212 | 1.259 | 1.295 | 1.260 | 1.221 | 1.183 |
| 1998 | 1.143 | 1.091 | 1.045 | 1.058 | 1.081 | 1.087 | 1.070 | 1.050 | 1.031 | 1.049 | 1.033 | 0.967 |
| 1999 | 0.950 | 0.927 | 0.965 | 1.092 | 1.113 | 1.110 | 1.161 | 1.233 | 1.281 | 1.311 | 1.305 | 1.328 |
| 2000 | 1.334 | 1.391 | 1.538 | 1.474 | 1.476 | 1.592 | 1.603 | 1.513 | 1.564 | 1.556 | 1.563 | 1.517 |
| 2001 | 1.478 | 1.477 | 1.419 | 1.518 | 1.641 | 1.587 | 1.434 | 1.380 | 1.428 | 1.293 | 1.171 | 1.114 |
| 2002 | 1.145 | 1.144 | 1.243 | 1.392 | 1.385 | 1.372 | 1.393 | 1.411 | 1.425 | 1.449 | 1.445 | 1.440 |
| 2003 | 1.514 | 1.636 | 1.671 | 1.574 | 1.480 | 1.469 | 1.501 | 1.590 | 1.701 | 1.610 | 1.552 | 1.534 |
| 2004 | 1.616 | 1.689 | 1.757 | 1.773 | 1.990 | 1.982 | 1.909 | 1.891 | 1.896 | 2.037 | 2.014 | 1.902 |
| 2005 | 1.892 | 1.957 | 2.090 | 2.232 | 2.153 | 2.171 | 2.295 | 2.471 | 3.027 | 2.675 | 2.301 | 2.278 |
| 2006 | 2.456 | 2.389 | 2.452 | 2.796 | 2.933 | 2.821 | 2.928 | 2.967 | 2.653 | 2.346 | 2.300 | 2.419 |
| 2007 | 2.369 | 2.320 | 2.641 | 2.847 | 3.041 | 3.035 | 2.953 | 2.821 | 2.806 | 2.882 | 3.169 | 3.160 |
| 2008 | 3.214 | 3.161 | 3.304 | 3.500 | 3.816 | 4.087 | 4.082 | 3.821 | 3.681 | 3.167 | 2.388 | 1.856 |
| 2009 | 1.833 | 2.011 | 2.032 | 2.117 | 2.321 | 2.655 | 2.599 | 2.691 | 2.629 | 2.603 | 2.755 | 2.709 |
| 2010 | 2.808 | 2.736 | 2.829 | 2.891 | 2.875 | 2.737 | 2.716 | 2.722 | 2.663 | 2.849 | 2.962 | 3.122 |
| 2011 | 3.198 | 3.273 | 3.597 | 3.823 | 3.947 | 3.740 | 3.699 | 3.683 | 3.660 | 3.535 | 3.474 | 3.390 |
| 2012 | 3.520 | 3.705 | 3.875 | 3.988 | 3.761 | 3.529 | 3.471 | 3.716 | 3.935 | 3.912 | 3.721 | 3.592 |
| 2013 | 3.595 | 3.811 | 3.802 | 3.648 | 3.541 | 3.550 | 3.637 | 3.666 | 3.643 | 3.468 | 3.416 | 3.522 |
| 2014 | 3.585 | 3.584 | 3.667 | 3.717 | 3.789 | 3.750 | 3.708 | 3.555 | 3.476 | 3.336 | 3.117 | 2.842 |
| 2015 | 2.450 | 2.378 | 2.551 | 2.577 | 2.769 | 2.835 | 2.801 | 2.609 | 2.410 | 2.315 | 2.285 | 2.220 |
| 2016 | 2.106 | 1.935 | 2.020 | 2.224 | 2.381 | 2.412 | 2.314 | 2.232 | 2.278 | 2.338 | 2.354 | 2.399 |
| 2017 | 2.540 | 2.465 | 2.429 | 2.524 | 2.518 | 2.446 | 2.400 | 2.477 | 2.788 | 2.645 | 2.692 | 2.647 |
| 2018 | 2.713 | 2.762 | 2.704 | 2.859 | 2.999 | 3.004 | 2.971 | 2.972 | 2.987 | 2.974 | 2.826 | 2.605 |
| 2019 | 2.458 | 2.480 | 2.653 | 2.862 | 2.940 | 2.819 | 2.855 | 2.766 | 2.713 | 2.708 | 2.710 | 2.719 |
| 2020 | 2.744 | 2.639 | 2.429 | 2.103 | 2.094 | 2.249 | 2.339 | 2.344 | 2.387 | 2.370 | 2.356 | 2.406 |
| 2021 | 2.527 | 2.684 | 2.921 | 2.921 | 3.037 | 3.128 | 3.195 | 3.233 | 3.289 | 3.428 | 3.562 | 3.512 |
| 2022 | 3.502 | 3.689 | 4.318 | 4.190 | 4.601 | 4.921 | 4.695 | 4.316 | 3.897 | 3.823 | 3.952 | 3.663 |
| 2023 | 3.599 | 3.627 | 3.544 | 3.639 | 3.664 | 3.647 | 3.683 | 3.914 | 3.885 | 3.784 | 3.611 | 3.464 |
| 2024 | 3.318 | 3.394 | 3.499 | 3.669 | ||||||||
| - = No Data Reported; -- = Not Applicable; NA = Not Available; W = Withheld to avoid disclosure of individual company data. |
| Release Date: 5/6/2024 |
| Next Release Date: 5/13/2024 |