|
Download Data (XLS File) |
|
||||||||||
|
||||||||||
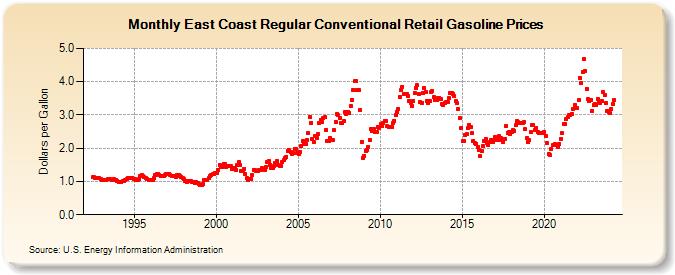
| East Coast Regular Conventional Retail Gasoline Prices (Dollars per Gallon) | ||||||||||
| Year | Jan | Feb | Mar | Apr | May | Jun | Jul | Aug | Sep | Oct | Nov | Dec |
|---|---|---|---|---|---|---|---|---|---|---|---|---|
| 1992 | NA | 1.119 | 1.125 | 1.112 | 1.102 | 1.098 | 1.098 | 1.079 | ||||
| 1993 | 1.058 | 1.044 | 1.035 | 1.050 | 1.071 | 1.075 | 1.064 | 1.048 | 1.031 | 1.064 | 1.048 | 1.011 |
| 1994 | 0.987 | 0.995 | 0.994 | 1.005 | 1.021 | 1.048 | 1.073 | 1.116 | 1.118 | 1.103 | 1.115 | 1.088 |
| 1995 | 1.059 | 1.048 | 1.042 | 1.074 | 1.159 | 1.183 | 1.154 | 1.122 | 1.099 | 1.074 | 1.038 | 1.035 |
| 1996 | 1.054 | 1.054 | 1.093 | 1.189 | 1.233 | 1.217 | 1.187 | 1.168 | 1.162 | 1.170 | 1.206 | 1.223 |
| 1997 | 1.224 | 1.217 | 1.193 | 1.175 | 1.164 | 1.157 | 1.137 | 1.181 | 1.198 | 1.166 | 1.138 | 1.103 |
| 1998 | 1.064 | 1.025 | 0.993 | 1.001 | 1.013 | 1.009 | 0.998 | 0.976 | 0.959 | 0.979 | 0.964 | 0.912 |
| 1999 | 0.897 | 0.880 | 0.921 | 1.040 | 1.057 | 1.046 | 1.093 | 1.155 | 1.199 | 1.216 | 1.221 | 1.250 |
| 2000 | 1.262 | 1.345 | 1.488 | 1.427 | 1.431 | 1.523 | 1.519 | 1.425 | 1.473 | 1.463 | 1.450 | 1.388 |
| 2001 | 1.394 | 1.414 | 1.359 | 1.482 | 1.570 | 1.505 | 1.327 | 1.307 | 1.381 | 1.235 | 1.092 | 1.034 |
| 2002 | 1.076 | 1.071 | 1.189 | 1.353 | 1.338 | 1.313 | 1.322 | 1.331 | 1.338 | 1.402 | 1.380 | 1.354 |
| 2003 | 1.432 | 1.575 | 1.612 | 1.504 | 1.406 | 1.419 | 1.469 | 1.562 | 1.606 | 1.505 | 1.467 | 1.461 |
| 2004 | 1.571 | 1.631 | 1.699 | 1.748 | 1.929 | 1.933 | 1.875 | 1.835 | 1.844 | 1.970 | 1.963 | 1.856 |
| 2005 | 1.839 | 1.898 | 2.059 | 2.224 | 2.138 | 2.130 | 2.252 | 2.453 | 2.942 | 2.766 | 2.275 | 2.191 |
| 2006 | 2.358 | 2.295 | 2.421 | 2.764 | 2.857 | 2.798 | 2.918 | 2.925 | 2.558 | 2.224 | 2.211 | 2.316 |
| 2007 | 2.245 | 2.235 | 2.534 | 2.802 | 3.026 | 2.985 | 2.910 | 2.743 | 2.763 | 2.810 | 3.085 | 3.041 |
| 2008 | 3.096 | 3.065 | 3.256 | 3.453 | 3.761 | 4.006 | 4.018 | 3.751 | 3.747 | 3.153 | 2.196 | 1.719 |
| 2009 | 1.772 | 1.929 | 1.959 | 2.048 | 2.241 | 2.584 | 2.509 | 2.577 | 2.492 | 2.501 | 2.651 | 2.613 |
| 2010 | 2.725 | 2.654 | 2.771 | 2.824 | 2.813 | 2.659 | 2.636 | 2.651 | 2.624 | 2.757 | 2.832 | 2.996 |
| 2011 | 3.091 | 3.192 | 3.535 | 3.741 | 3.851 | 3.617 | 3.624 | 3.628 | 3.565 | 3.419 | 3.372 | 3.277 |
| 2012 | 3.431 | 3.645 | 3.808 | 3.890 | 3.623 | 3.377 | 3.350 | 3.653 | 3.820 | 3.701 | 3.432 | 3.357 |
| 2013 | 3.427 | 3.691 | 3.714 | 3.525 | 3.453 | 3.463 | 3.515 | 3.523 | 3.477 | 3.324 | 3.284 | 3.357 |
| 2014 | 3.386 | 3.384 | 3.500 | 3.646 | 3.667 | 3.622 | 3.563 | 3.418 | 3.354 | 3.170 | 2.908 | 2.606 |
| 2015 | 2.203 | 2.208 | 2.386 | 2.415 | 2.597 | 2.695 | 2.646 | 2.442 | 2.218 | 2.170 | 2.125 | 2.034 |
| 2016 | 1.932 | 1.769 | 1.921 | 2.071 | 2.231 | 2.280 | 2.153 | 2.098 | 2.183 | 2.235 | 2.178 | 2.252 |
| 2017 | 2.343 | 2.272 | 2.260 | 2.361 | 2.314 | 2.249 | 2.198 | 2.287 | 2.679 | 2.471 | 2.479 | 2.417 |
| 2018 | 2.499 | 2.548 | 2.520 | 2.682 | 2.807 | 2.779 | 2.746 | 2.755 | 2.753 | 2.773 | 2.564 | 2.293 |
| 2019 | 2.185 | 2.253 | 2.472 | 2.694 | 2.693 | 2.542 | 2.621 | 2.488 | 2.466 | 2.457 | 2.442 | 2.465 |
| 2020 | 2.485 | 2.359 | 2.145 | 1.812 | 1.793 | 1.982 | 2.087 | 2.089 | 2.119 | 2.102 | 2.045 | 2.135 |
| 2021 | 2.278 | 2.447 | 2.728 | 2.742 | 2.863 | 2.933 | 2.984 | 2.998 | 3.040 | 3.181 | 3.307 | 3.220 |
| 2022 | 3.213 | 3.447 | 4.115 | 3.951 | 4.283 | 4.673 | 4.319 | 3.783 | 3.470 | 3.410 | 3.456 | 3.123 |
| 2023 | 3.291 | 3.327 | 3.299 | 3.479 | 3.402 | 3.372 | 3.421 | 3.694 | 3.593 | 3.352 | 3.127 | 3.088 |
| 2024 | 3.043 | 3.175 | 3.328 | |||||||||
| - = No Data Reported; -- = Not Applicable; NA = Not Available; W = Withheld to avoid disclosure of individual company data. |
| Release Date: 4/22/2024 |
| Next Release Date: 4/29/2024 |